QUESTION IMAGE
Question
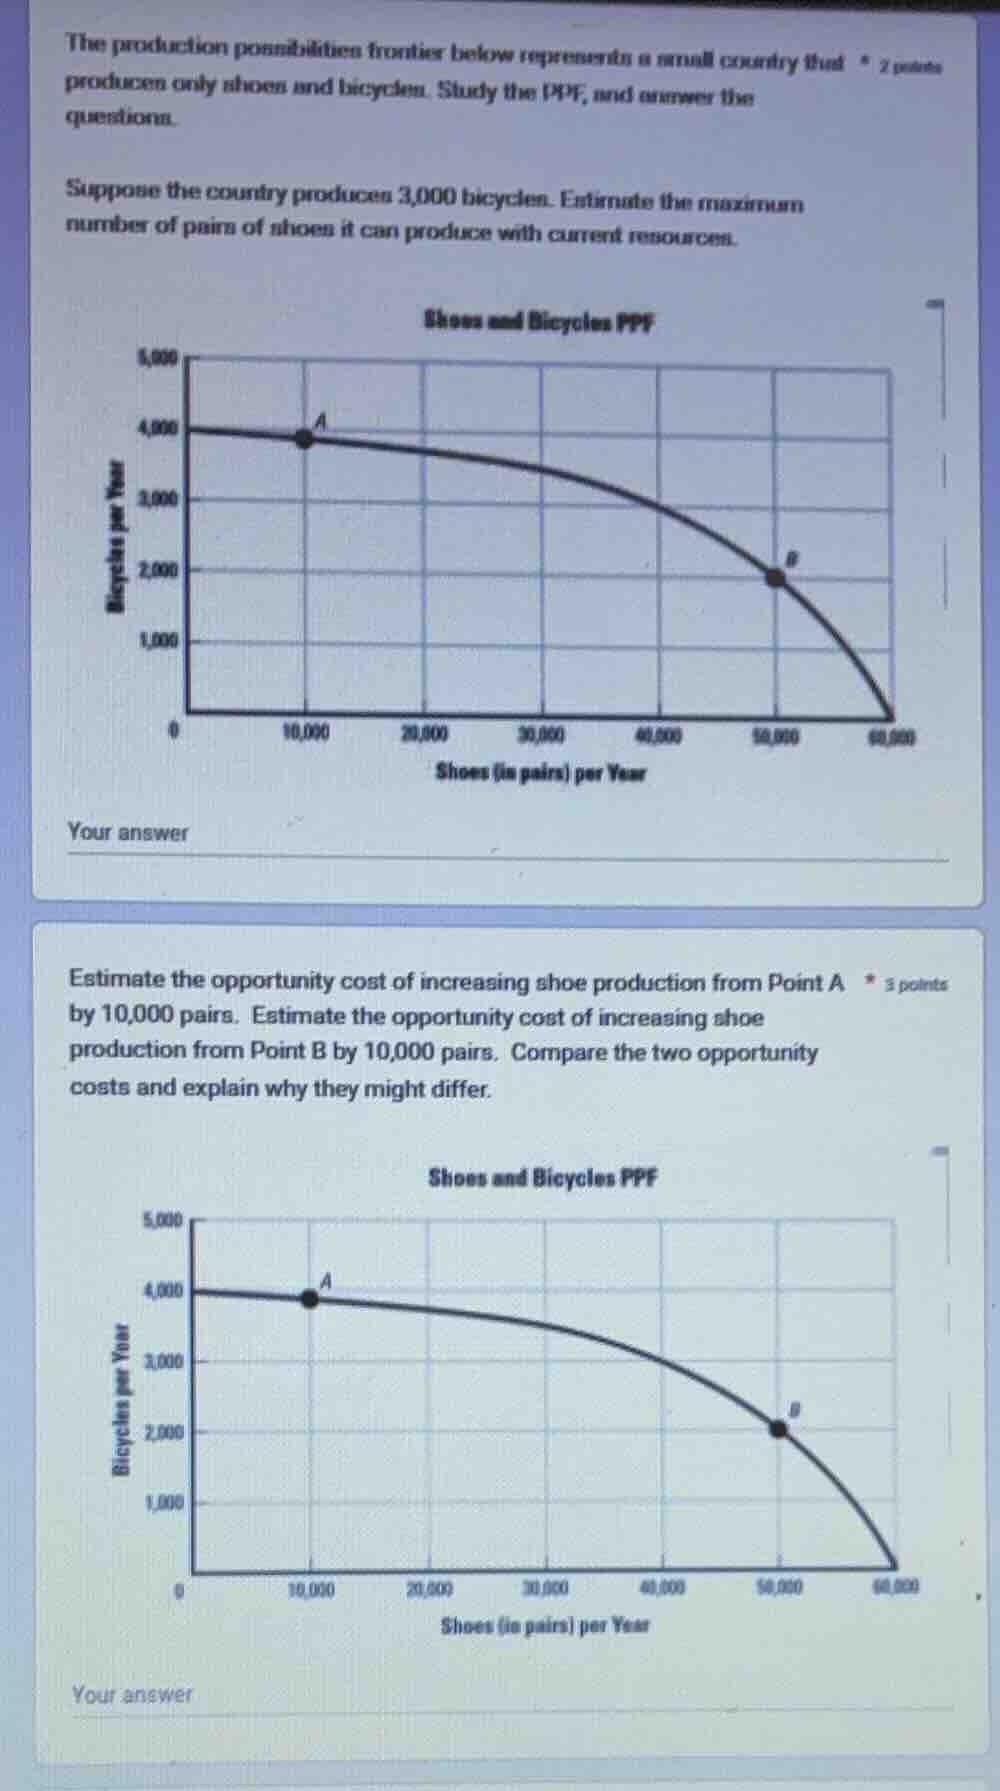
the production possibilities frontier below represents a small country that produces only shoes and bicycles. study the ppf, and answer the questions.
suppose the country produces 3,000 bicycles. estimate the maximum number of pairs of shoes it can produce with current resources.
estimate the opportunity cost of increasing shoe production from point a by 10,000 pairs. estimate the opportunity cost of increasing shoe production from point b by 10,000 pairs. compare the two opportunity costs and explain why they might differ.
Step1: Locate 3,000 bicycles on PPF
On the PPF graph, find the point where bicycles = 3,000. This aligns with shoes = 30,000 pairs.
Step2: Calculate opportunity cost from Point A
Point A: (10,000 shoes, 4,000 bicycles). Add 10,000 shoes: new point (20,000 shoes, ~3,800 bicycles).
Opportunity cost = $4000 - 3800 = 200$ bicycles.
Step3: Calculate opportunity cost from Point B
Point B: (50,000 shoes, 2,000 bicycles). Add 10,000 shoes: new point (60,000 shoes, 0 bicycles).
Opportunity cost = $2000 - 0 = 2000$ bicycles.
Step4: Explain cost difference
The PPF is bowed outward, so resources are not equally efficient for both goods. As we produce more shoes, we shift resources less suited for shoes, increasing opportunity cost.

Snap & solve any problem in the app
Get step-by-step solutions on Sovi AI
Photo-based solutions with guided steps
Explore more problems and detailed explanations
- Maximum number of shoe pairs when producing 3,000 bicycles: 30,000 pairs
- Opportunity cost from Point A: 200 bicycles; Opportunity cost from Point B: 2,000 bicycles. The costs differ because of the law of increasing opportunity cost: resources are not equally productive in making shoes and bicycles, so shifting more resources to shoes (moving further along the PPF) gives up increasingly more bicycles per pair of shoes.