QUESTION IMAGE
Question
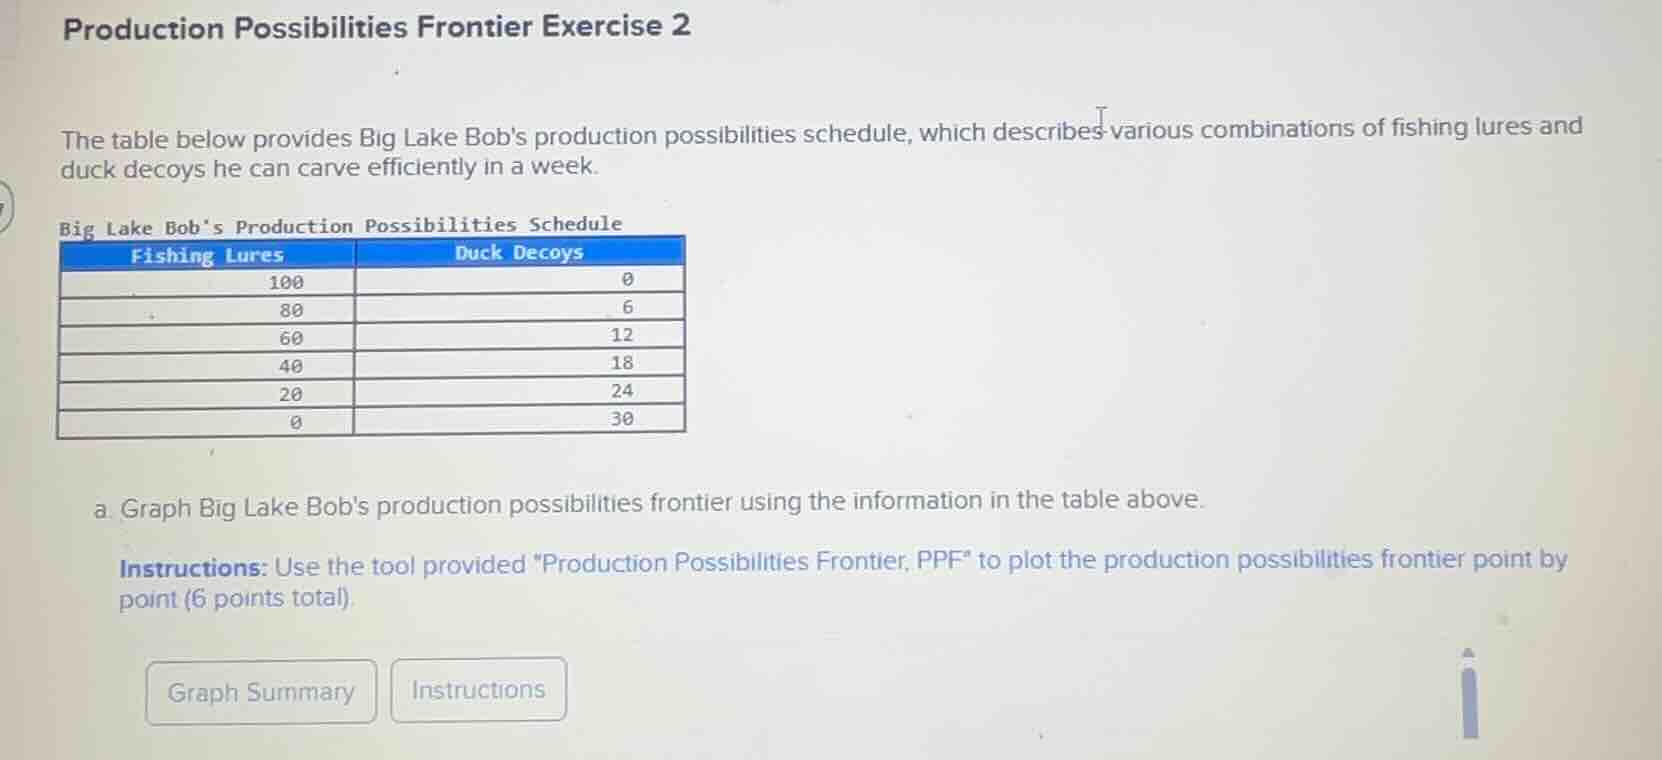
production possibilities frontier exercise 2
the table below provides big lake bobs production possibilities schedule, which describes various combinations of fishing lures and duck decoys he can carve efficiently in a week.
big lake bobs production possibilities schedule
fishing lures | duck decoys
100 | 0
80 | 6
60 | 12
40 | 18
20 | 24
0 | 30
a. graph big lake bobs production possibilities frontier using the information in the table above.
instructions: use the tool provided \production possibilities frontier, ppf\ to plot the production possibilities frontier point by point (6 points total).
graph summary instructions
To graph the Production Possibilities Frontier (PPF), plot each pair of values from the table as coordinate points, with Fishing Lures on one axis (typically the x-axis) and Duck Decoys on the other axis (typically the y-axis), then connect the points in order.

Snap & solve any problem in the app
Get step-by-step solutions on Sovi AI
Photo-based solutions with guided steps
Explore more problems and detailed explanations
Plot the following 6 points and connect them sequentially:
- (100, 0)
- (80, 6)
- (60, 12)
- (40, 18)
- (20, 24)
- (0, 30)