QUESTION IMAGE
Question
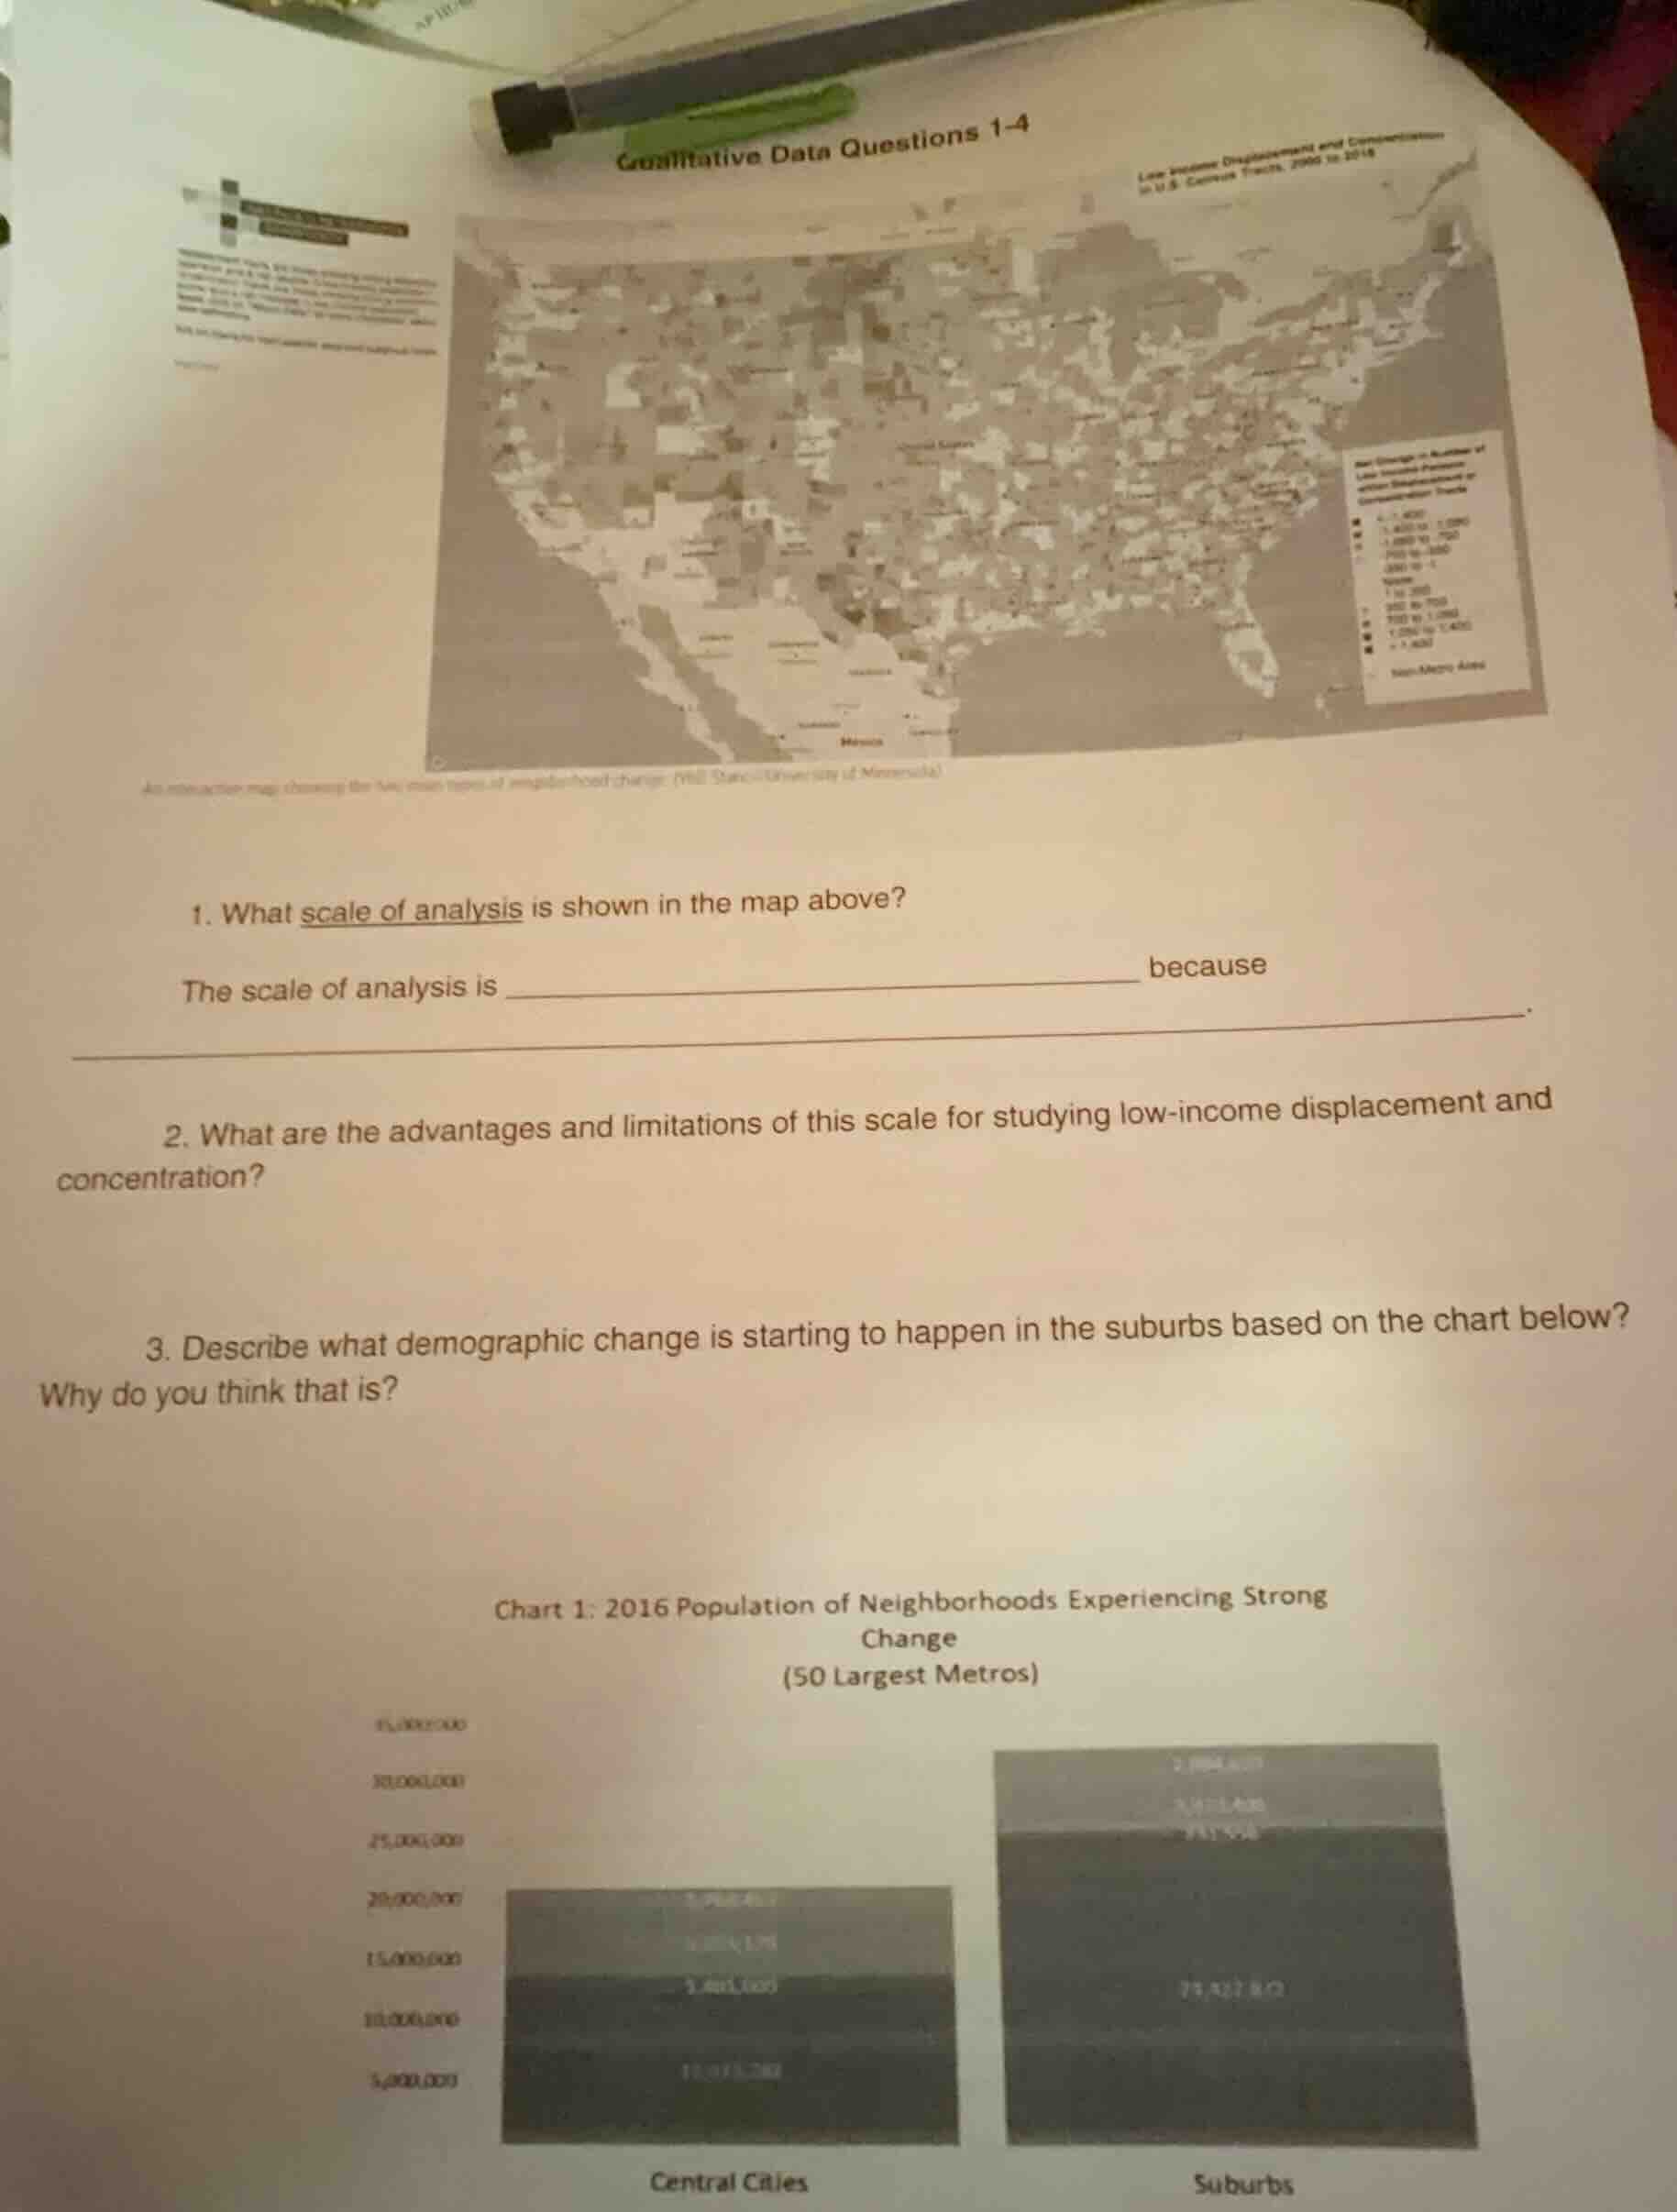
qualitative data questions 1-4
low-income displacement and concentration
in u.s. census tracts, 2000 to 2016
an interactive map showing the two main types of neighborhood change (ipsr, stanford university of minnesota)
- what scale of analysis is shown in the map above?
the scale of analysis is ___________________________ because
_________________________________________________________________________.
- what are the advantages and limitations of this scale for studying low-income displacement and concentration?
- describe what demographic change is starting to happen in the suburbs based on the chart below? why do you think that is?
chart 1: 2016 population of neighborhoods experiencing strong change
(50 largest metros)
central cities suburbs
- The map focuses on U.S. census tracts, small subdivisions of counties used for demographic data collection, as indicated by the title referencing "U.S. Census Tracts, 2000 to 2018".
- For this scale, advantages include capturing hyper-local demographic shifts tied to displacement; limitations include masking broader regional trends and high data complexity.
- The chart shows suburbs have a larger population in neighborhoods with strong demographic change than central cities, including a growing low-income population. This is likely due to rising central city costs pushing low-income households to more affordable suburbs, plus suburban economic shifts creating low-wage jobs.

Snap & solve any problem in the app
Get step-by-step solutions on Sovi AI
Photo-based solutions with guided steps
Explore more problems and detailed explanations
- The scale of analysis is census tract (neighborhood) scale because the map explicitly references U.S. Census Tracts, and the data is mapped at a small, localized neighborhood-level geography.
- Advantages:
- Captures precise, hyper-local patterns of low-income displacement and concentration that would be invisible at larger scales.
- Aligns with how neighborhood-level gentrification and displacement directly impact households.
Limitations:
- Can obscure regional or metropolitan-wide trends by focusing on small areas.
- May lead to overemphasis on small, isolated changes rather than broader systemic shifts.
- Demographic change: Suburbs now have a larger total population in neighborhoods experiencing strong demographic change than central cities, with a fast-growing low-income population in these suburban neighborhoods.
Reason: Low-income households are increasingly moving to suburbs to escape rising housing and living costs in central cities, while suburban areas are also seeing growth in low-wage service jobs that draw and retain low-income residents.