QUESTION IMAGE
Question
quantitative reasoning
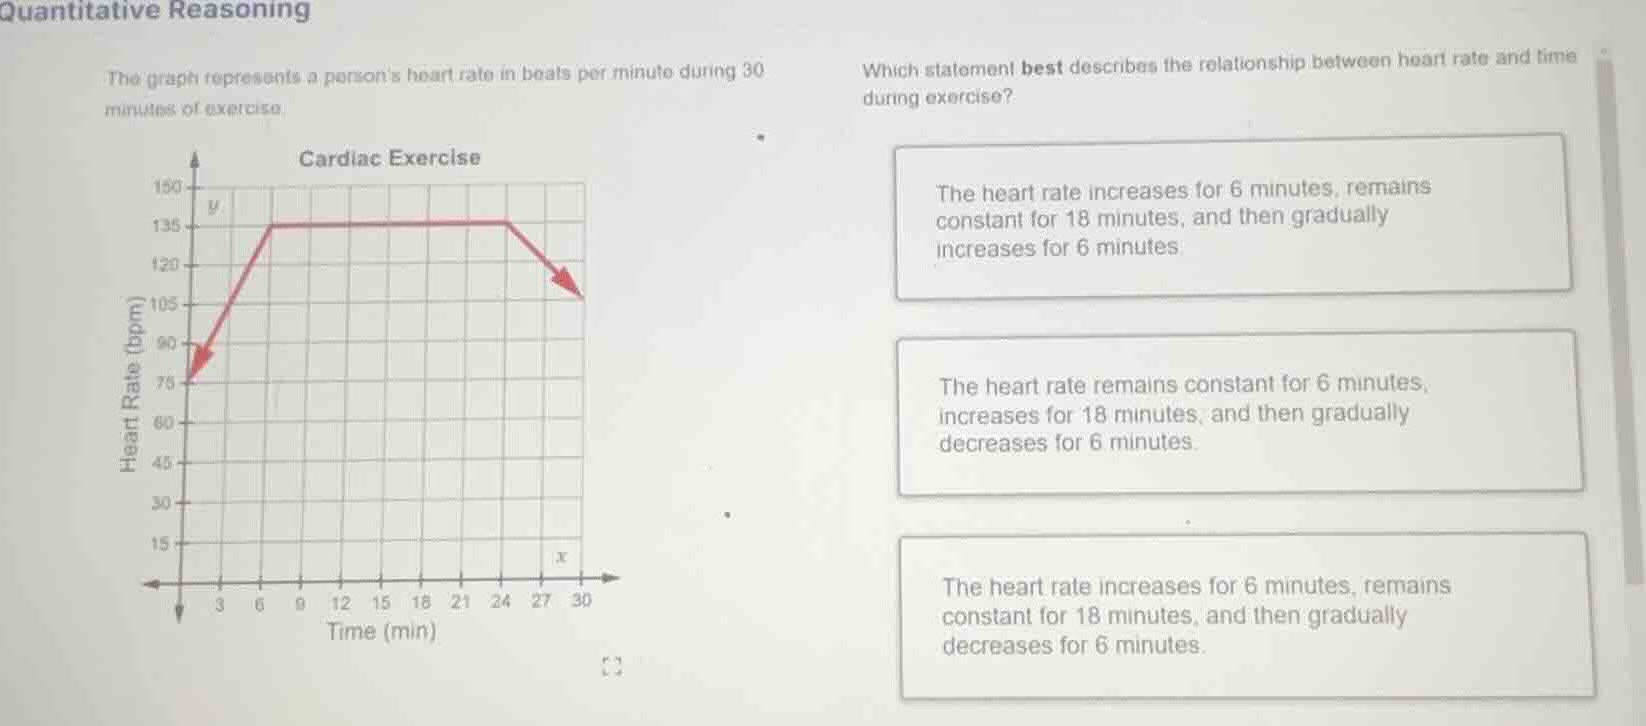
the graph represents a persons heart rate in beats per minute during 30 minutes of exercise
cardiac exercise
which statement best describes the relationship between heart rate and time during exercise?
the heart rate increases for 6 minutes, remains constant for 18 minutes, and then gradually increases for 6 minutes
the heart rate remains constant for 6 minutes, increases for 18 minutes, and then gradually decreases for 6 minutes.
the heart rate increases for 6 minutes, remains constant for 18 minutes, and then gradually decreases for 6 minutes.
- Analyze the graph: The x - axis is time (minutes) and y - axis is heart rate (bpm).
- From \(x = 0\) to \(x = 6\) (6 minutes), the heart rate increases from 75 bpm to 135 bpm (since the line is rising).
- From \(x = 6\) to \(x = 24\) (24 - 6=18 minutes), the heart rate remains constant at 135 bpm (the line is horizontal).
- From \(x = 24\) to \(x = 30\) (30 - 24 = 6 minutes), the heart rate decreases (the line is falling).
So the correct statement is "The heart rate increases for 6 minutes, remains constant for 18 minutes, and then gradually decreases for 6 minutes".

Snap & solve any problem in the app
Get step-by-step solutions on Sovi AI
Photo-based solutions with guided steps
Explore more problems and detailed explanations
The heart rate increases for 6 minutes, remains constant for 18 minutes, and then gradually decreases for 6 minutes.