QUESTION IMAGE
Question
question 36 of 40
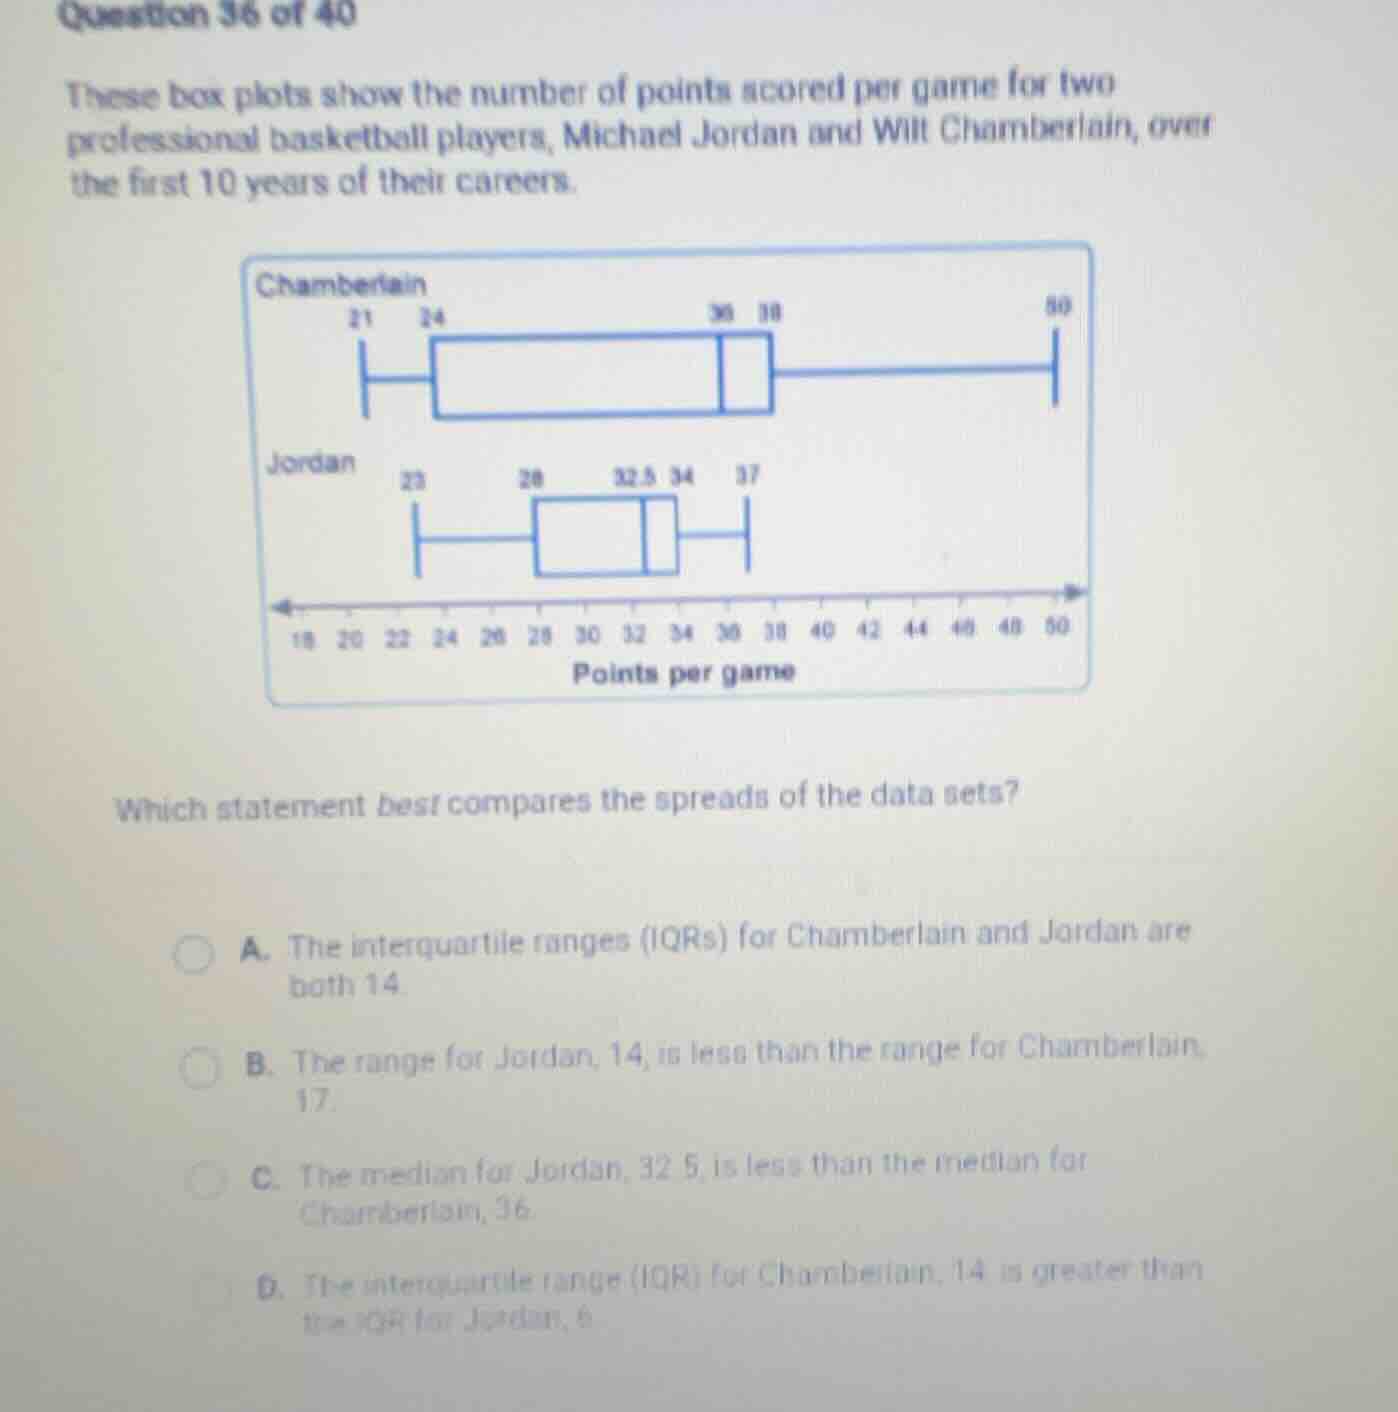
these box plots show the number of points scored per game for two professional basketball players, michael jordan and wilt chamberlain, over the first 10 years of their careers.
which statement best compares the spreads of the data sets?
a. the interquartile ranges (iqrs) for chamberlain and jordan are both 14.
b. the range for jordan, 14, is less than the range for chamberlain, 17.
c. the median for jordan, 32.5, is less than the median for chamberlain, 36.
d. the interquartile range (iqr) for chamberlain, 14, is greater than the iqr for jordan, 6.
Step1: Calculate Chamberlain's IQR
IQR = Q3 - Q1 = $38 - 24 = 14$
Step2: Calculate Jordan's IQR
IQR = Q3 - Q1 = $34 - 28 = 6$
Step3: Calculate Chamberlain's range
Range = Max - Min = $50 - 21 = 29$
Step4: Calculate Jordan's range
Range = Max - Min = $37 - 23 = 14$
Step5: Evaluate all options
- Option A: Jordan's IQR is 6, not 14. Incorrect.
- Option B: Chamberlain's range is 29, not 17. Incorrect.
- Option C: Compares medians, not spreads. Incorrect.
- Option D: Chamberlain's IQR (14) > Jordan's IQR (6). Correct.

Snap & solve any problem in the app
Get step-by-step solutions on Sovi AI
Photo-based solutions with guided steps
Explore more problems and detailed explanations
D. The interquartile range (IQR) for Chamberlain, 14, is greater than the IQR for Jordan, 6.