QUESTION IMAGE
Question
question
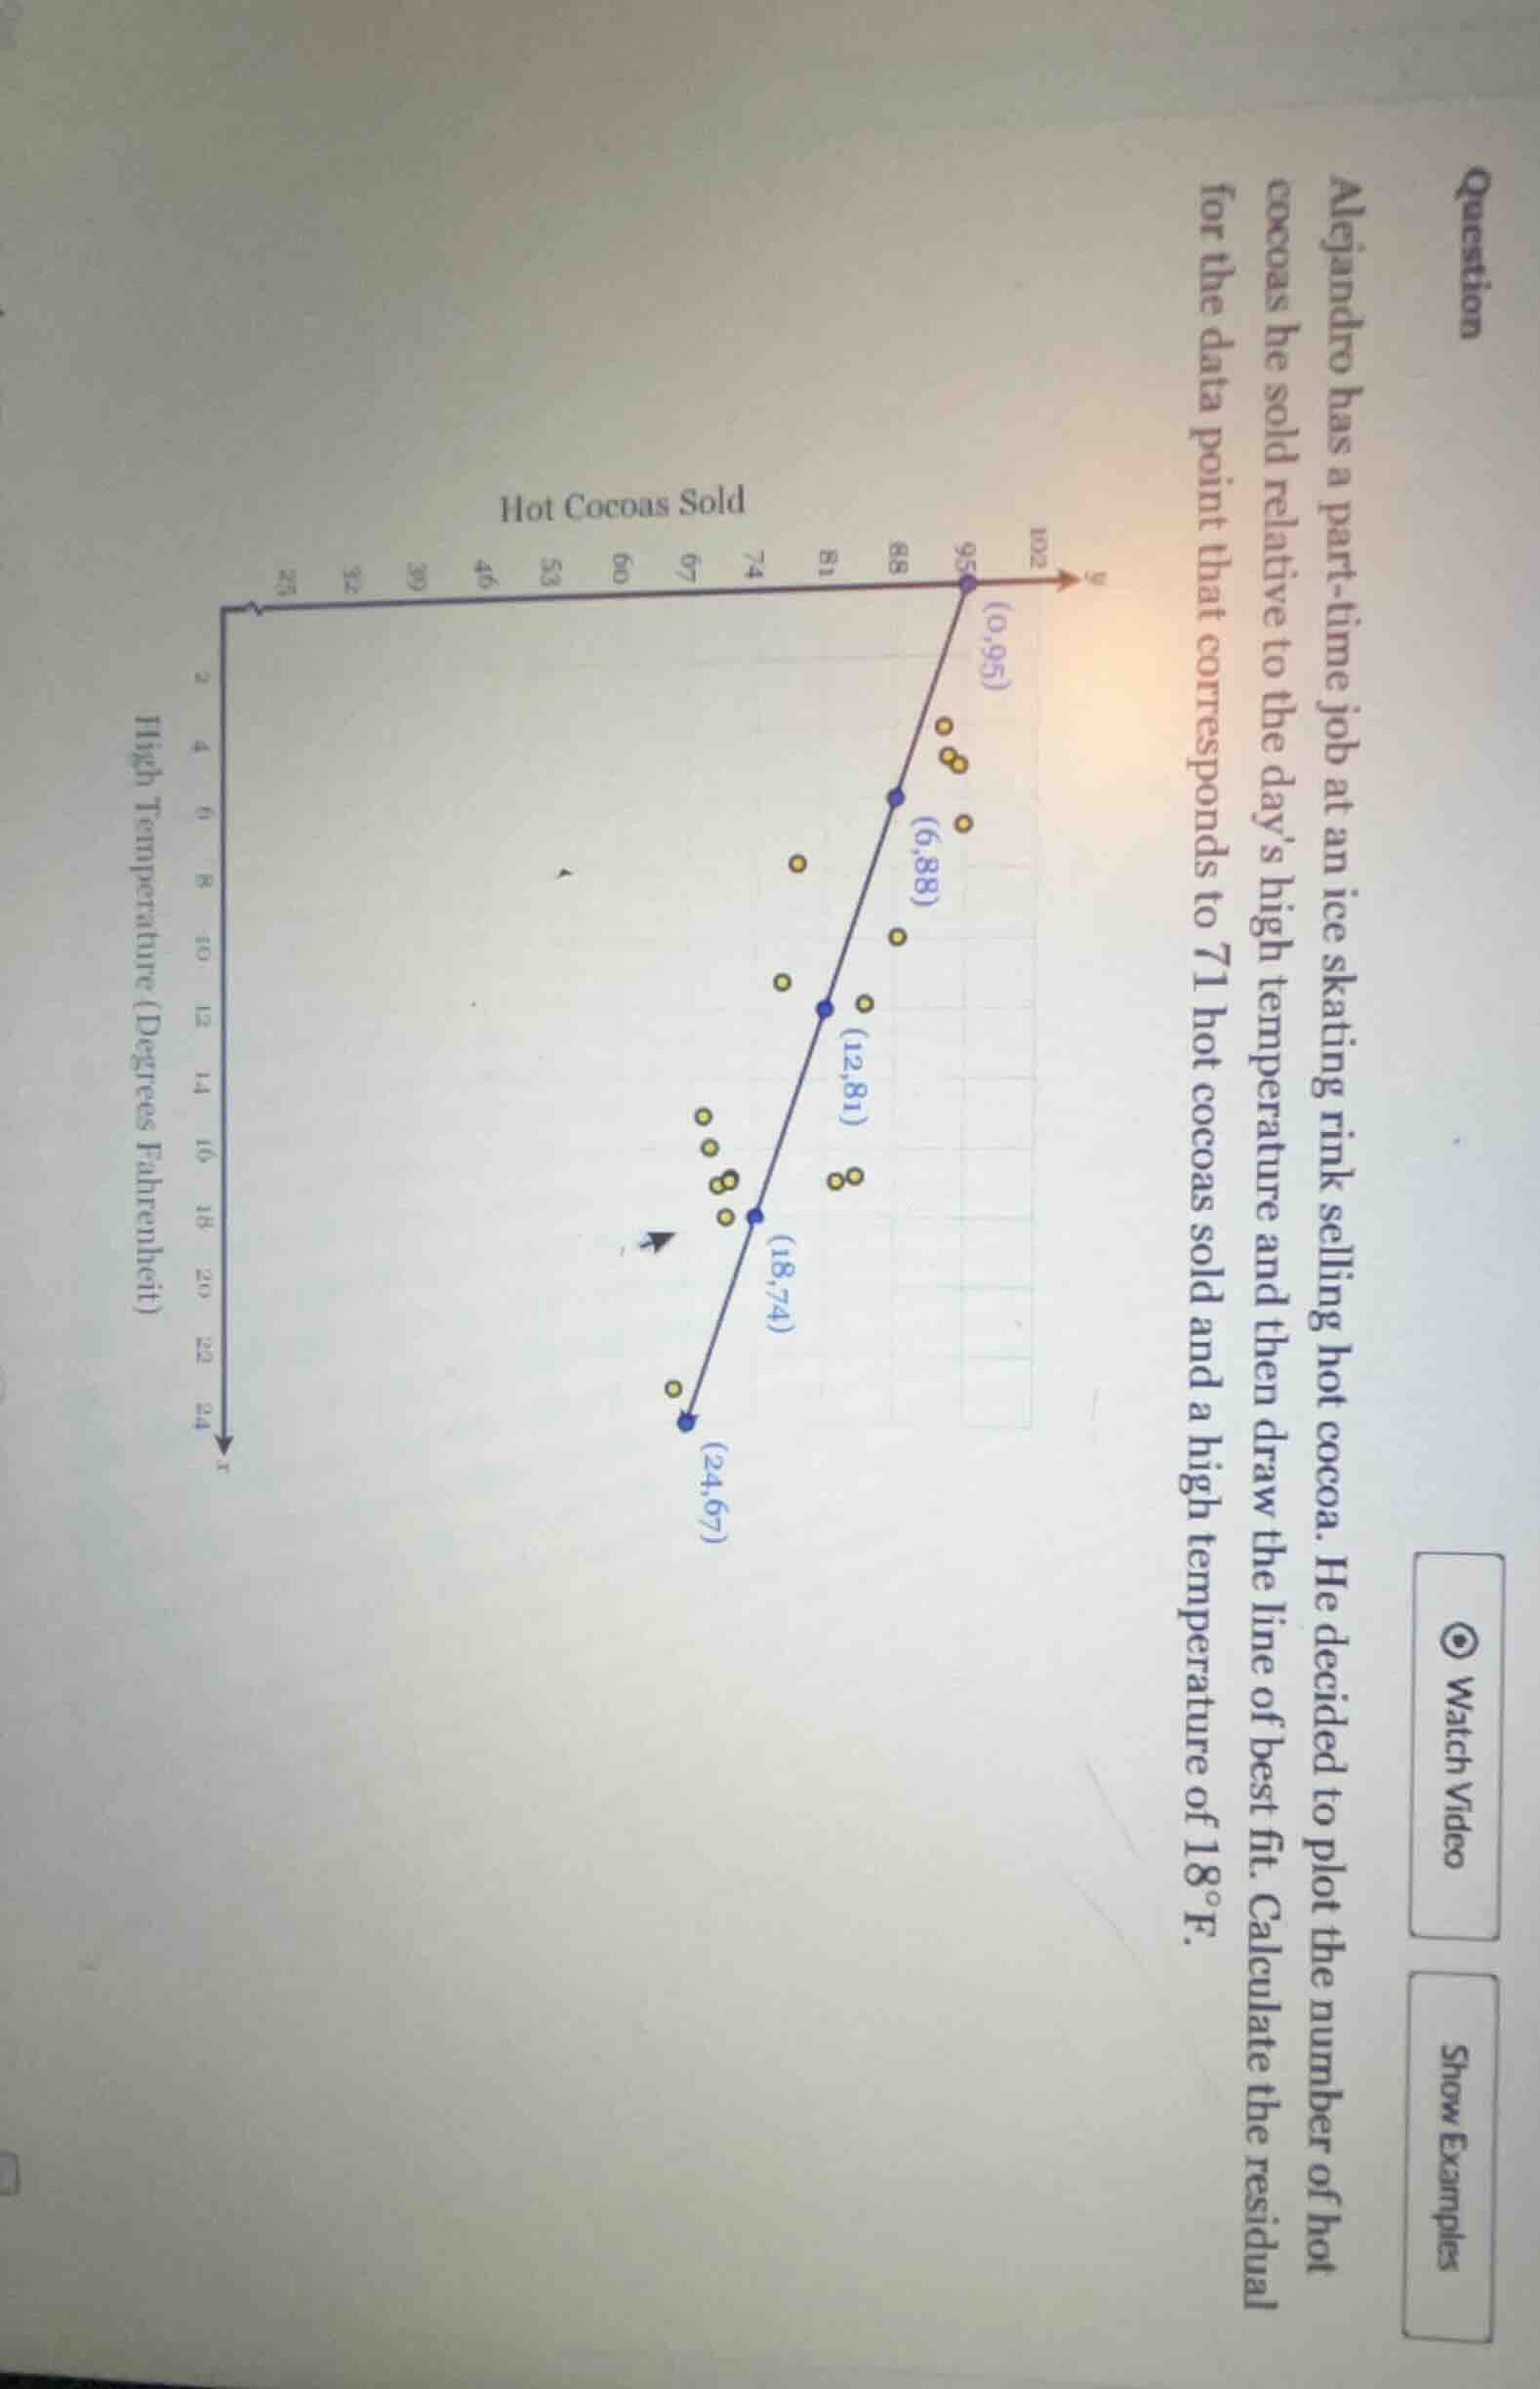
alejandro has a part - time job at an ice skating rink selling hot cocoa. he decided to plot the number of hot cocoas he sold relative to the day’s high temperature and then draw the line of best fit. calculate the residual for the data point that corresponds to 71 hot cocoas sold and a high temperature of 18°f.
(the chart is about hot cocoas sold, with x - axis as high temperature (degrees fahrenheit) and y - axis as hot cocoas sold, and some data points like (0,95), (6,88), (12,81), (18,74), (24,67) on the line of best fit, and some yellow dots as actual data points.)
Step1: Find line of best fit equation
First, use two points on the line, e.g., $(0,95)$ and $(24,67)$.
Slope: $m=\frac{67-95}{24-0}=\frac{-28}{24}=-\frac{7}{6}\approx-1.1667$
Y-intercept $b=95$, so equation: $y=-\frac{7}{6}x + 95$
Step2: Calculate predicted value
Substitute $x=18$ into the equation:
$y=-\frac{7}{6}(18)+95 = -21 + 95 = 74$
Step3: Calculate residual
Residual = Observed value - Predicted value
Observed value = 71, so:
$\text{Residual}=71 - 74$

Snap & solve any problem in the app
Get step-by-step solutions on Sovi AI
Photo-based solutions with guided steps
Explore more problems and detailed explanations
$-3$