QUESTION IMAGE
Question
question
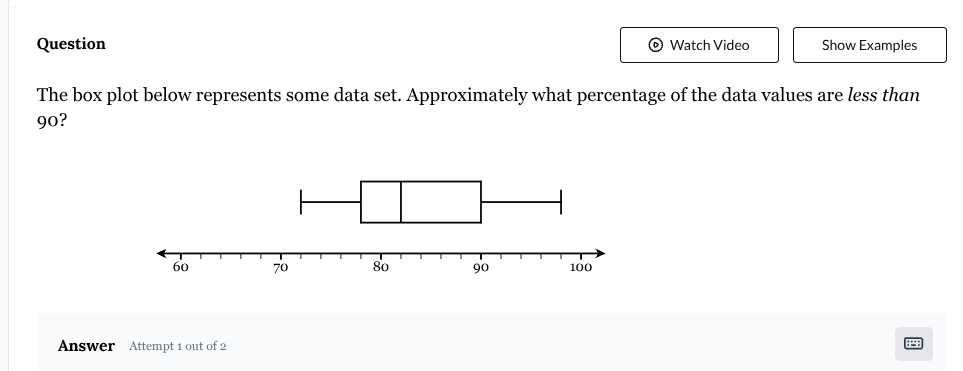
the box plot below represents some data set. approximately what percentage of the data values are less than 90?
answer attempt 1 out of 2
Step1: Recall Box Plot Percentiles
A box plot has quartiles: minimum, Q1 (25th percentile), median (50th percentile), Q3 (75th percentile), maximum. The box spans Q1 to Q3 (middle 50%), and the whiskers extend from min to Q1 and Q3 to max. Here, 90 is at Q3 (since the right end of the box is at 90? Wait, looking at the plot: the box has two parts? Wait, maybe the box is split, but typically, in a box plot, Q3 is the third quartile, meaning 75% of data is below Q3. Wait, let's check the x - axis: the box is from, say, 75? No, the labels: 60,70,80,90,100. The box is between, let's see, the right end of the box is at 90? Wait, the plot: the horizontal axis, the box has a right edge at 90. So Q3 (third quartile) is 90. By definition of quartiles, Q3 is the value where 75% of the data is less than or equal to Q3. Wait, but maybe the box is from Q1 to Q3, and the median is in the middle. Wait, the box is divided into two parts, maybe the median is at 85? But regardless, the key is that in a box plot, the third quartile (Q3) represents the value where 75% of the data is below it. Wait, no: Q1 is 25th percentile (25% below), median 50th (50% below), Q3 75th (75% below). So if the right end of the box (Q3) is at 90, then approximately 75% of the data is less than 90? Wait, no, wait: let's think again. The box plot's components: the lower whisker (min to Q1), the lower box (Q1 to median), upper box (median to Q3), upper whisker (Q3 to max). So Q3 is the third quartile, so 75% of the data is less than Q3. Wait, but in the plot, the right end of the box is at 90, so Q3 = 90. Therefore, approximately 75% of the data values are less than 90. Wait, but maybe I made a mistake. Wait, let's check the x - axis: the numbers are 60,70,80,90,100. The box is from, say, 75 to 90? No, the box is drawn with two rectangles? Wait, maybe it's a modified box plot, but the standard interpretation is that Q3 (third quartile) is the value where 75% of data is below it. So if the right end of the box (Q3) is at 90, then 75% of the data is less than 90. Wait, but maybe the median is at 85, and Q3 at 90. So the percentage of data less than 90 is 75%? Wait, no, wait: quartiles: Q1 (25% below), median (50% below), Q3 (75% below). So yes, Q3 is the 75th percentile, so 75% of data is below Q3. So if Q3 is 90, then 75% of data is less than 90.
Wait, maybe the box is from, say, 70 to 90? No, the plot: the box has a left end at, maybe, 75, and right end at 90. But the key concept is that in a box plot, the third quartile (Q3) is the value such that 75% of the data lies below Q3. So if the right boundary of the box (which is Q3) is at 90, then approximately 75% of the data is less than 90. Wait, but maybe I messed up. Wait, let's recall:
- The first quartile (Q1): 25% of data is below Q1.
- The median (Q2): 50% of data is below Q2.
- The third quartile (Q3): 75% of data is below Q3.
So in the box plot, the right end of the box is Q3. So if the right end of the box is at 90, then Q3 = 90, so 75% of the data is less than 90.
Step2: Confirm with the Plot
Looking at the given box plot, the right - most part of the box (the third quartile marker) is at 90. By the definition of the third quartile, 75% of the data values are less than the third quartile value. So the percentage of data values less than 90 is 75%.

Snap & solve any problem in the app
Get step-by-step solutions on Sovi AI
Photo-based solutions with guided steps
Explore more problems and detailed explanations
75%