QUESTION IMAGE
Question
question
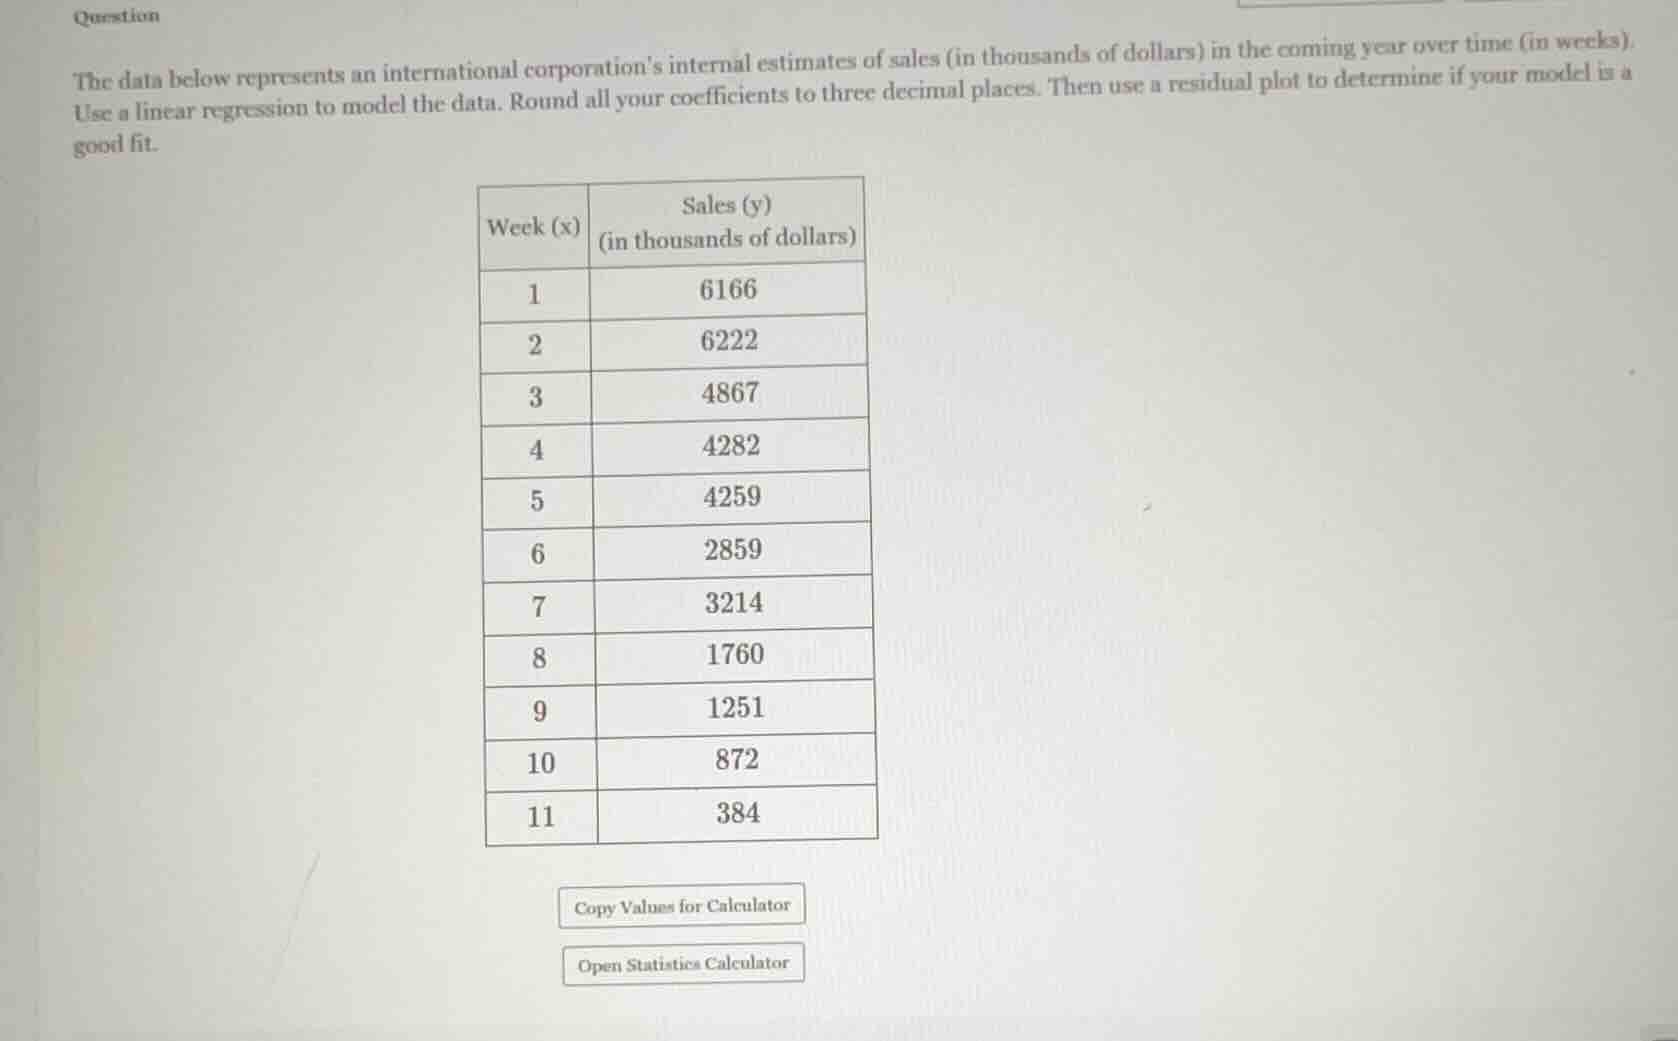
the data below represents an international corporations internal estimates of sales (in thousands of dollars) in the coming year over time (in weeks).
use a linear regression to model the data. round all your coefficients to three decimal places. then use a residual plot to determine if your model is a good fit.
week (x) | sales (y) (in thousands of dollars)
1 | 6166
2 | 6222
3 | 4867
4 | 4282
5 | 4259
6 | 2859
7 | 3214
8 | 1760
9 | 1251
10 | 872
11 | 384
copy values for calculator
open statistics calculator

Snap & solve any problem in the app
Get step-by-step solutions on Sovi AI
Photo-based solutions with guided steps
Explore more problems and detailed explanations
$\hat{y} = 6106.091 - 514.136x$
The linear model is not a good fit, as the residual plot shows a non-random pattern.