QUESTION IMAGE
Question
question
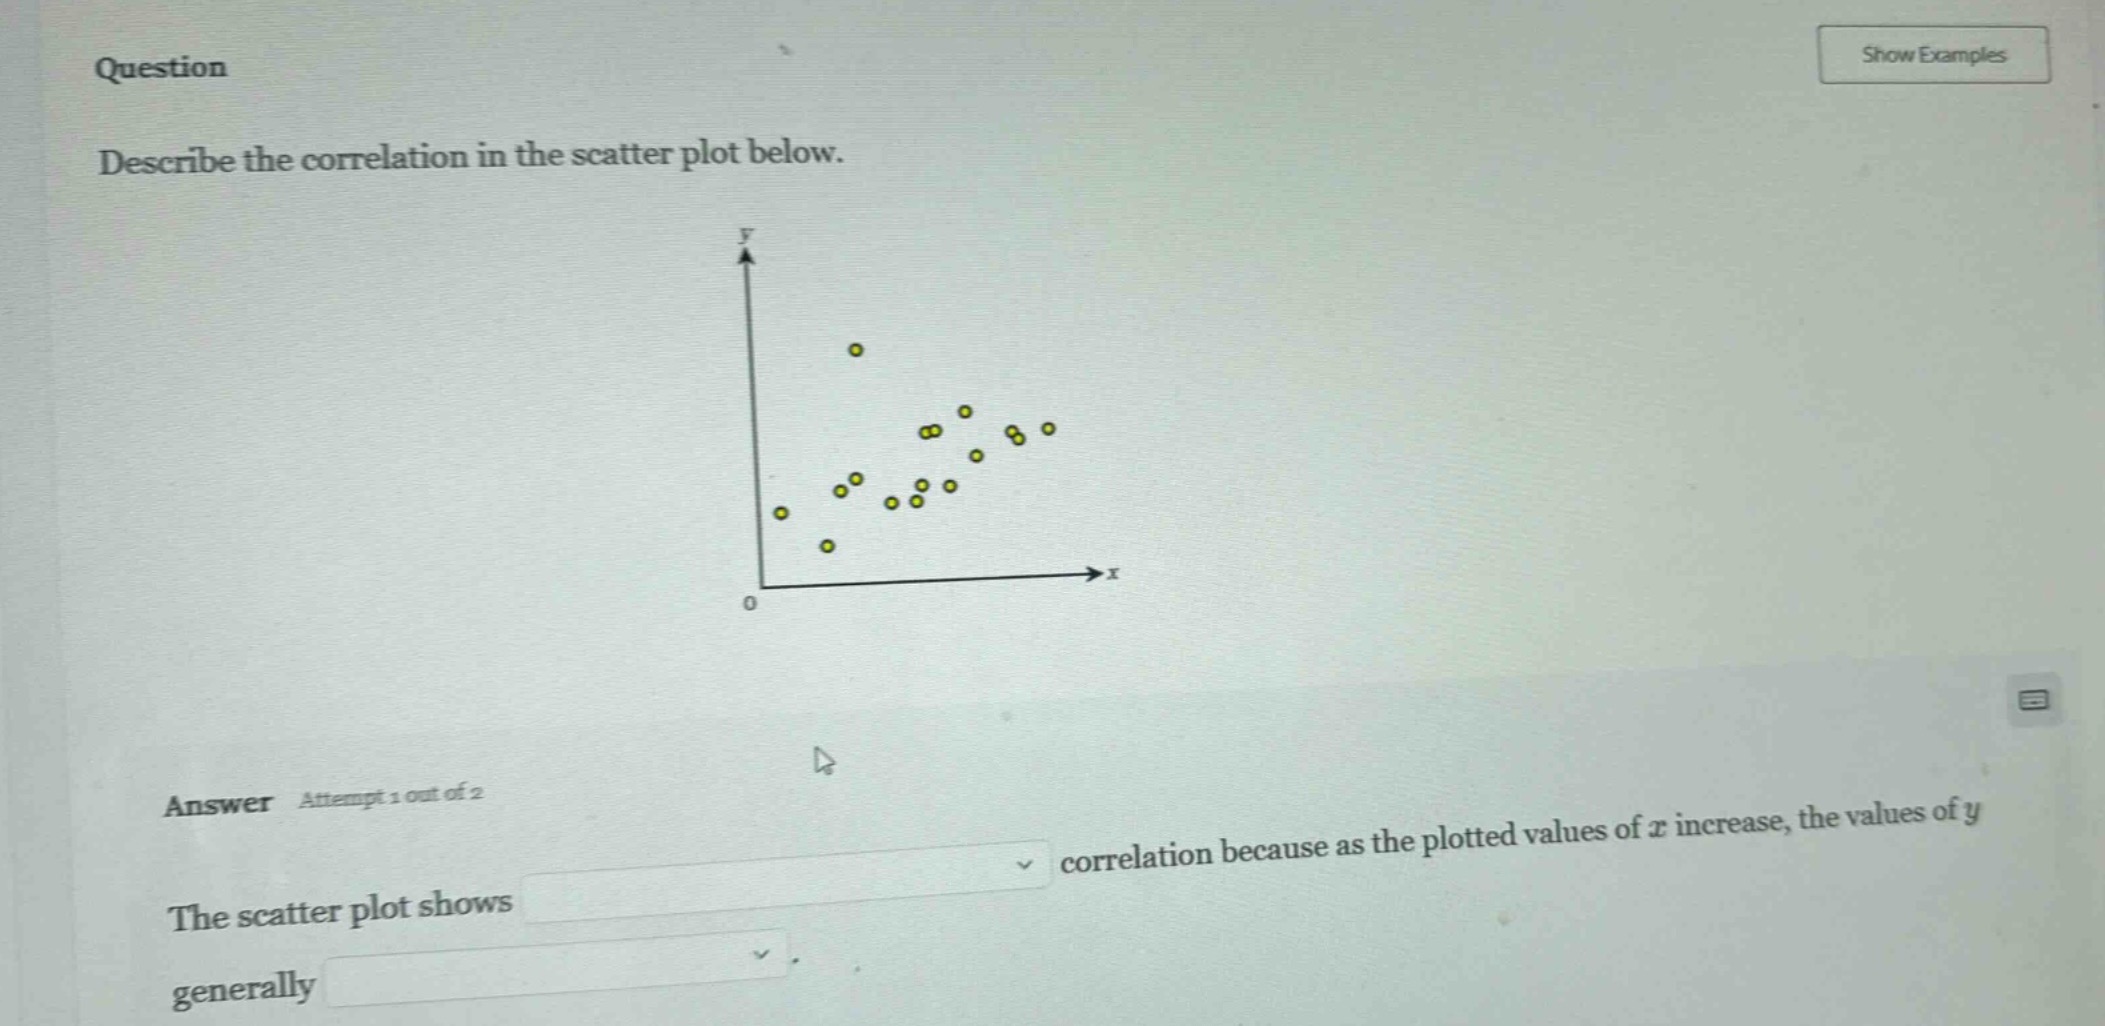
describe the correlation in the scatter plot below.
answer attempt 1 out of 2
the scatter plot shows
correlation because as the plotted values of ( x ) increase, the values of ( y )
generally
To determine the correlation, we analyze the scatter plot. The points show a general upward trend as \( x \) increases, but there is some scatter (not a perfect line). A positive correlation means as one variable increases, the other tends to increase. Since the points have a loose upward trend (not perfectly linear, so "weak" or "moderate" positive, but the main direction is positive), we identify the type. The first dropdown is for the type (positive, negative, no), and the second for the direction of \( y \) as \( x \) increases (increase, decrease, stay same). Here, as \( x \) increases, \( y \) generally increases, and the correlation is positive (likely weak or moderate, but the key is positive and increasing).

Snap & solve any problem in the app
Get step-by-step solutions on Sovi AI
Photo-based solutions with guided steps
Explore more problems and detailed explanations
The scatter plot shows \(\boldsymbol{\text{positive}}\) correlation because as the plotted values of \( x \) increase, the values of \( y \) generally \(\boldsymbol{\text{increase}}\).