QUESTION IMAGE
Question
question 3
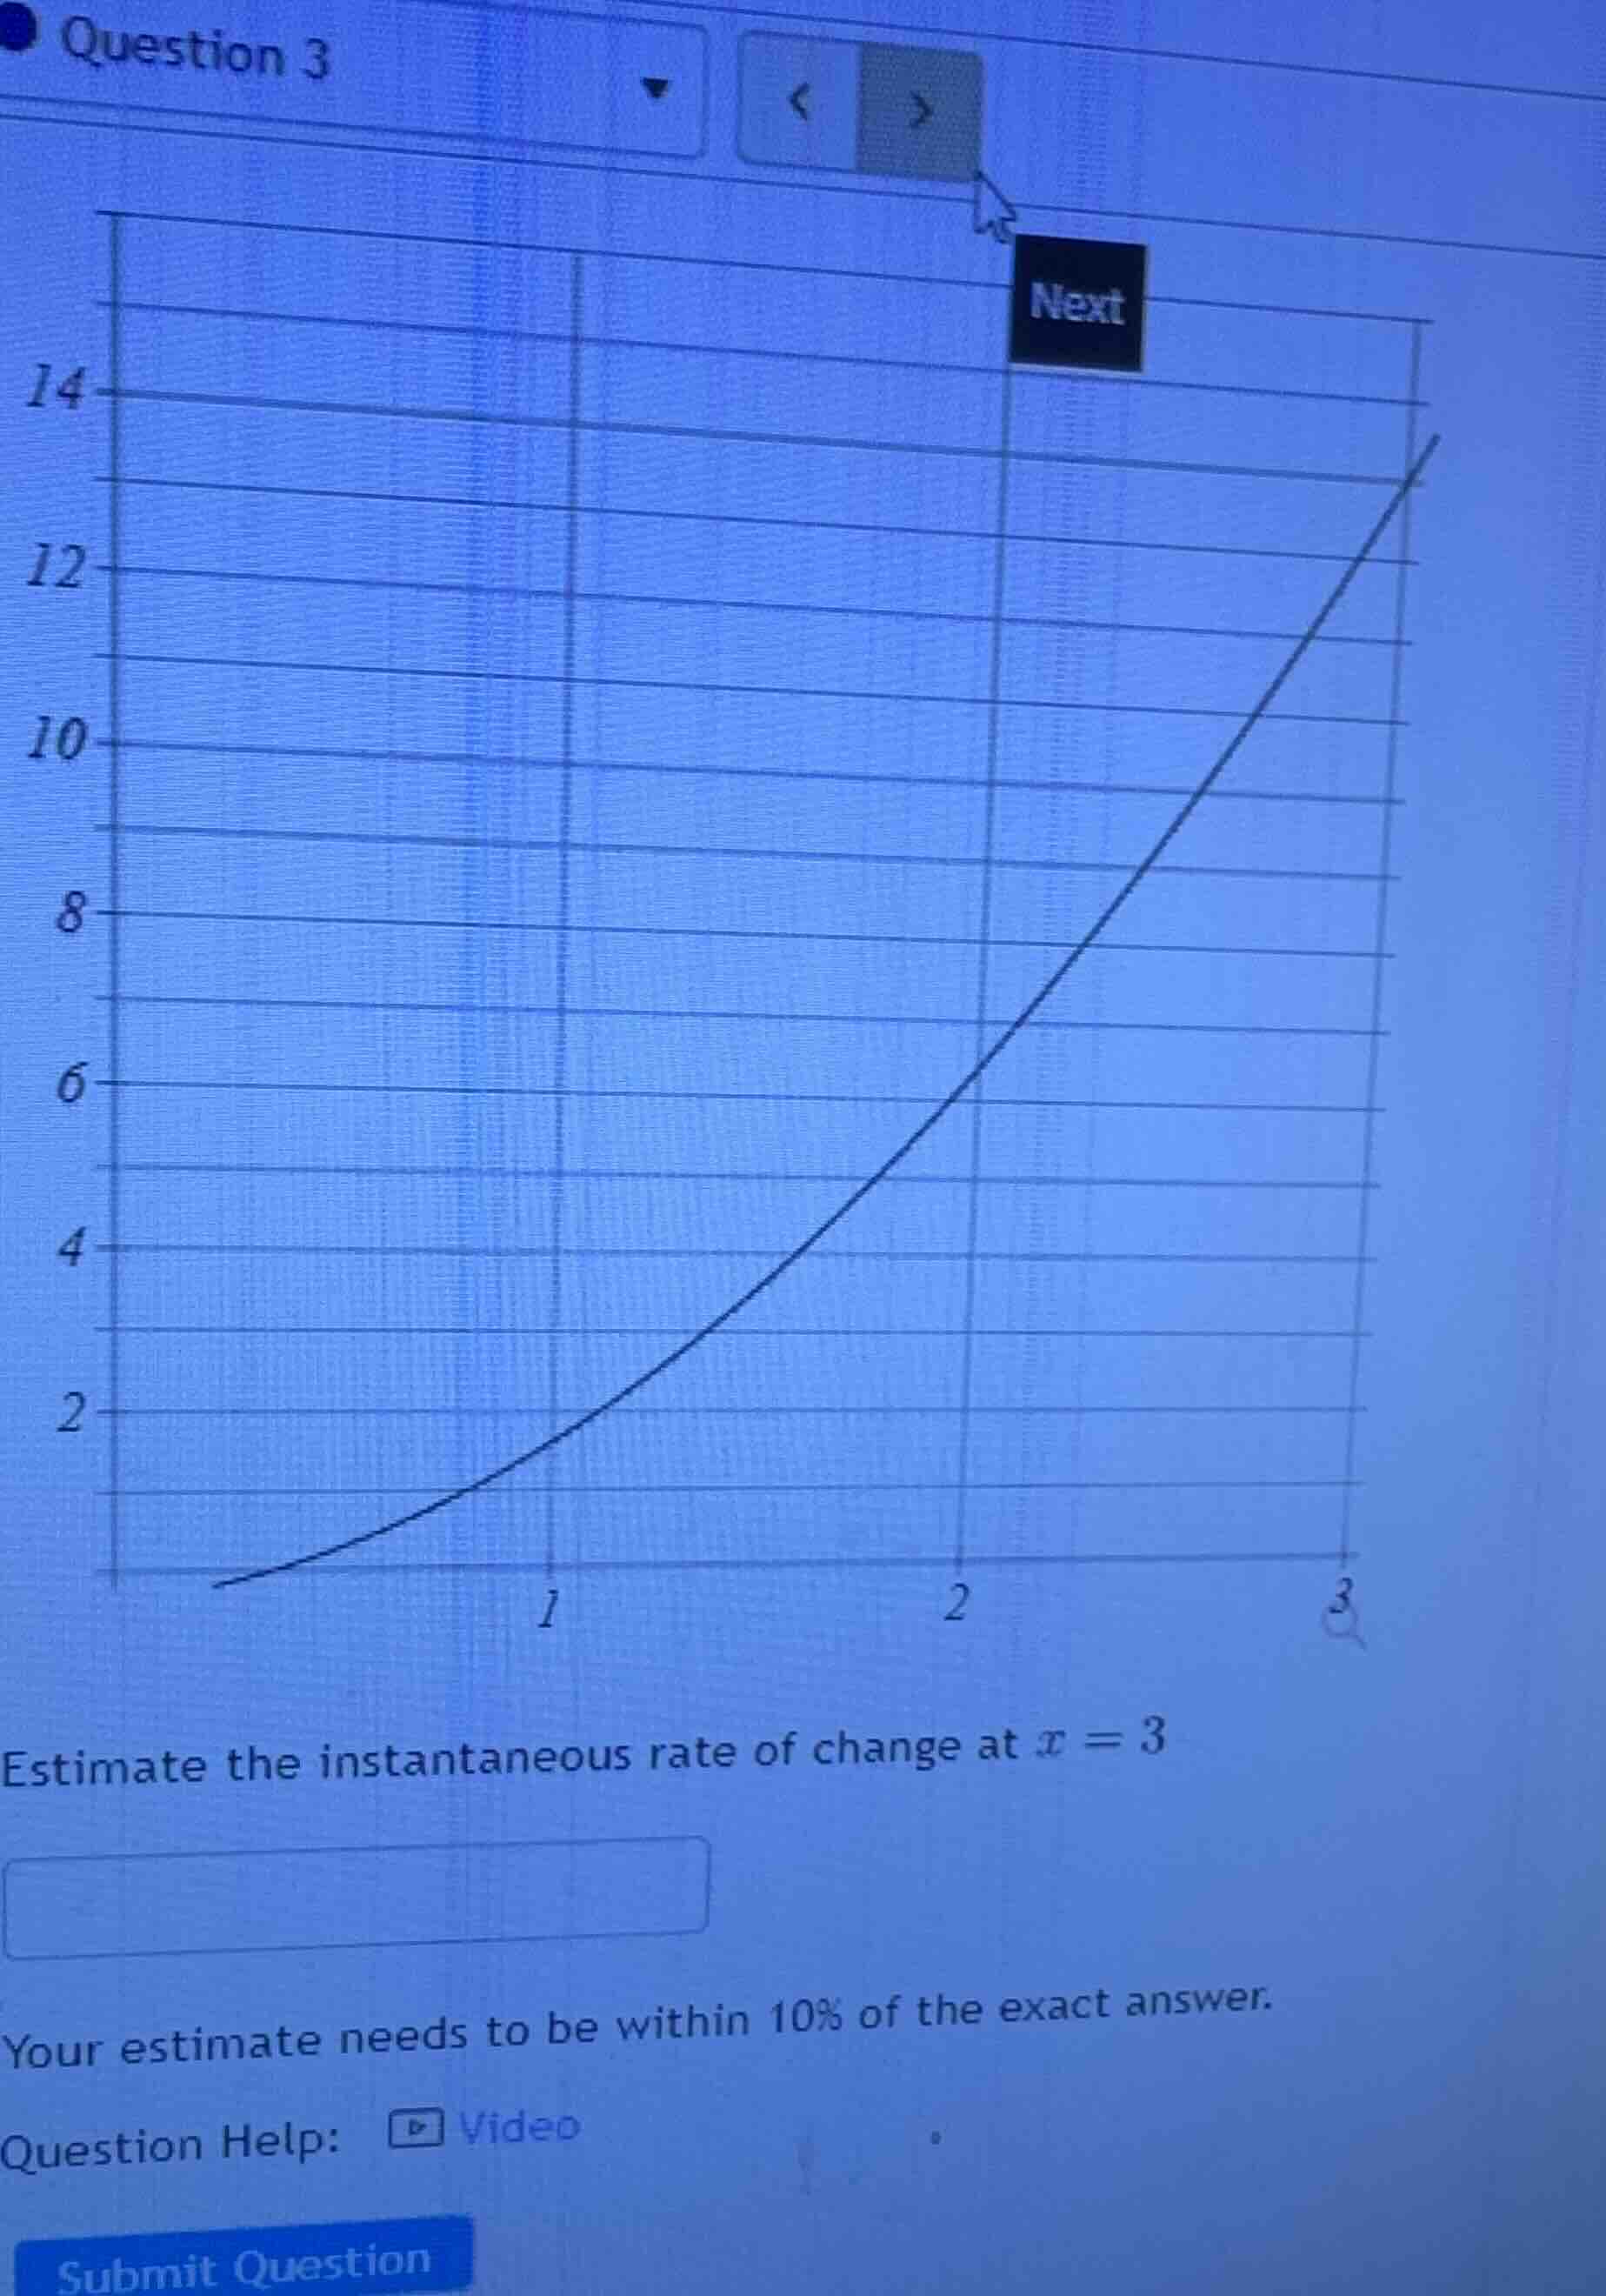
estimate the instantaneous rate of change at ( x = 3 )
your estimate needs to be within 10% of the exact answer.
question help: video
submit question
Step1: Identify two points near \( x = 3 \)
Looking at the graph, at \( x = 2 \), the \( y \)-value is \( 6 \), and at \( x = 3 \), we can estimate the \( y \)-value. From the slope, let's check the interval around \( x = 3 \). Let's take \( x = 2 \) ( \( y = 6 \)) and \( x = 3 \) (estimate \( y \) at \( x = 3 \)). From the graph, the line seems to have a constant slope (since it's a straight line? Wait, the left part is curved, but near \( x = 3 \), it's a straight line? Wait, maybe it's a linear function after some point. Wait, at \( x = 1 \), \( y = 2 \); \( x = 2 \), \( y = 6 \). Wait, no, at \( x = 1 \), the \( y \)-value is 2? Wait, the vertical line at \( x = 1 \) meets the graph at \( y = 2 \), \( x = 2 \) at \( y = 6 \), \( x = 3 \) at \( y = 10 \)? Wait, no, the grid lines: each horizontal line is 2 units? Wait, no, the y-axis has 14, 12, 10, 8, 6, 4, 2. So each major grid is 2, but the lines between are 1? Wait, no, the distance between 2 and 4 is 2, so each small grid is 1? Wait, at \( x = 1 \), the graph is at \( y = 2 \); \( x = 2 \), \( y = 6 \); \( x = 3 \), \( y = 10 \)? Wait, no, the slope between \( x = 1 \) ( \( y = 2 \)) and \( x = 2 \) ( \( y = 6 \)) is \( \frac{6 - 2}{2 - 1} = 4 \). Between \( x = 2 \) ( \( y = 6 \)) and \( x = 3 \), if the slope is constant (since the line is straight there), then the slope would be \( \frac{y(3) - 6}{3 - 2} \). If we assume the slope is constant (linear), then from \( x = 1 \) to \( x = 2 \), slope is \( 6 - 2 = 4 \) over 1 unit, so slope 4. Then from \( x = 2 \) to \( x = 3 \), slope should be 4, so \( y(3) = 6 + 4 = 10 \). Wait, but the graph at \( x = 3 \) is near 14? No, wait, the top line is 14, then 12, 10, 8, 6, 4, 2. Wait, maybe I misread. Wait, the vertical axis: the first line is 2, then 4, 6, 8, 10, 12, 14. So each line is 2 units? No, the distance between 2 and 4 is 2, so each grid line is 2? Wait, no, the numbers are 14, 12, 10, 8, 6, 4, 2. So each major tick is 2, but the lines between are 1? Wait, no, the graph at \( x = 1 \) is at \( y = 2 \) (the line at \( y = 2 \)), \( x = 2 \) at \( y = 6 \) (the line at \( y = 6 \)), \( x = 3 \) at \( y = 10 \) (the line at \( y = 10 \))? Wait, no, the slope between \( x = 1 \) ( \( y = 2 \)) and \( x = 2 \) ( \( y = 6 \)) is \( \frac{6 - 2}{2 - 1} = 4 \). Then between \( x = 2 \) ( \( y = 6 \)) and \( x = 3 \), the slope would be \( \frac{y(3) - 6}{3 - 2} \). If the function is linear (the right part is a straight line), then the slope is constant. So from \( x = 1 \) to \( x = 2 \), slope is 4, so from \( x = 2 \) to \( x = 3 \), slope is also 4, so \( y(3) = 6 + 4 = 10 \). Wait, but the graph at \( x = 3 \) is near 14? No, maybe I made a mistake. Wait, the vertical line at \( x = 3 \) meets the graph at \( y = 10 \)? No, the top of the graph is near 14, but the line at \( x = 3 \) is at \( y = 10 \)? Wait, no, let's check the grid again. The horizontal lines: 2, 4, 6, 8, 10, 12, 14. So each line is 2 units? No, the distance between 2 and 4 is 2, so each grid line is 2, but the numbers are 2, 4, 6, etc. Wait, at \( x = 1 \), the graph is at \( y = 2 \) (the line labeled 2), \( x = 2 \) at \( y = 6 \) (the line labeled 6), \( x = 3 \) at \( y = 10 \) (the line labeled 10). So the slope between \( x = 1 \) ( \( y = 2 \)) and \( x = 2 \) ( \( y = 6 \)) is \( \frac{6 - 2}{2 - 1} = 4 \). Between \( x = 2 \) ( \( y = 6 \)) and \( x = 3 \) ( \( y = 10 \)), slope is \( \frac{10 - 6}{3 - 2} = 4 \). So the instantaneous rate of change at \( x = 3 \) is the slope of the tangent line, which for a linear function is the slope of…

Snap & solve any problem in the app
Get step-by-step solutions on Sovi AI
Photo-based solutions with guided steps
Explore more problems and detailed explanations
\( 4 \)