QUESTION IMAGE
Question
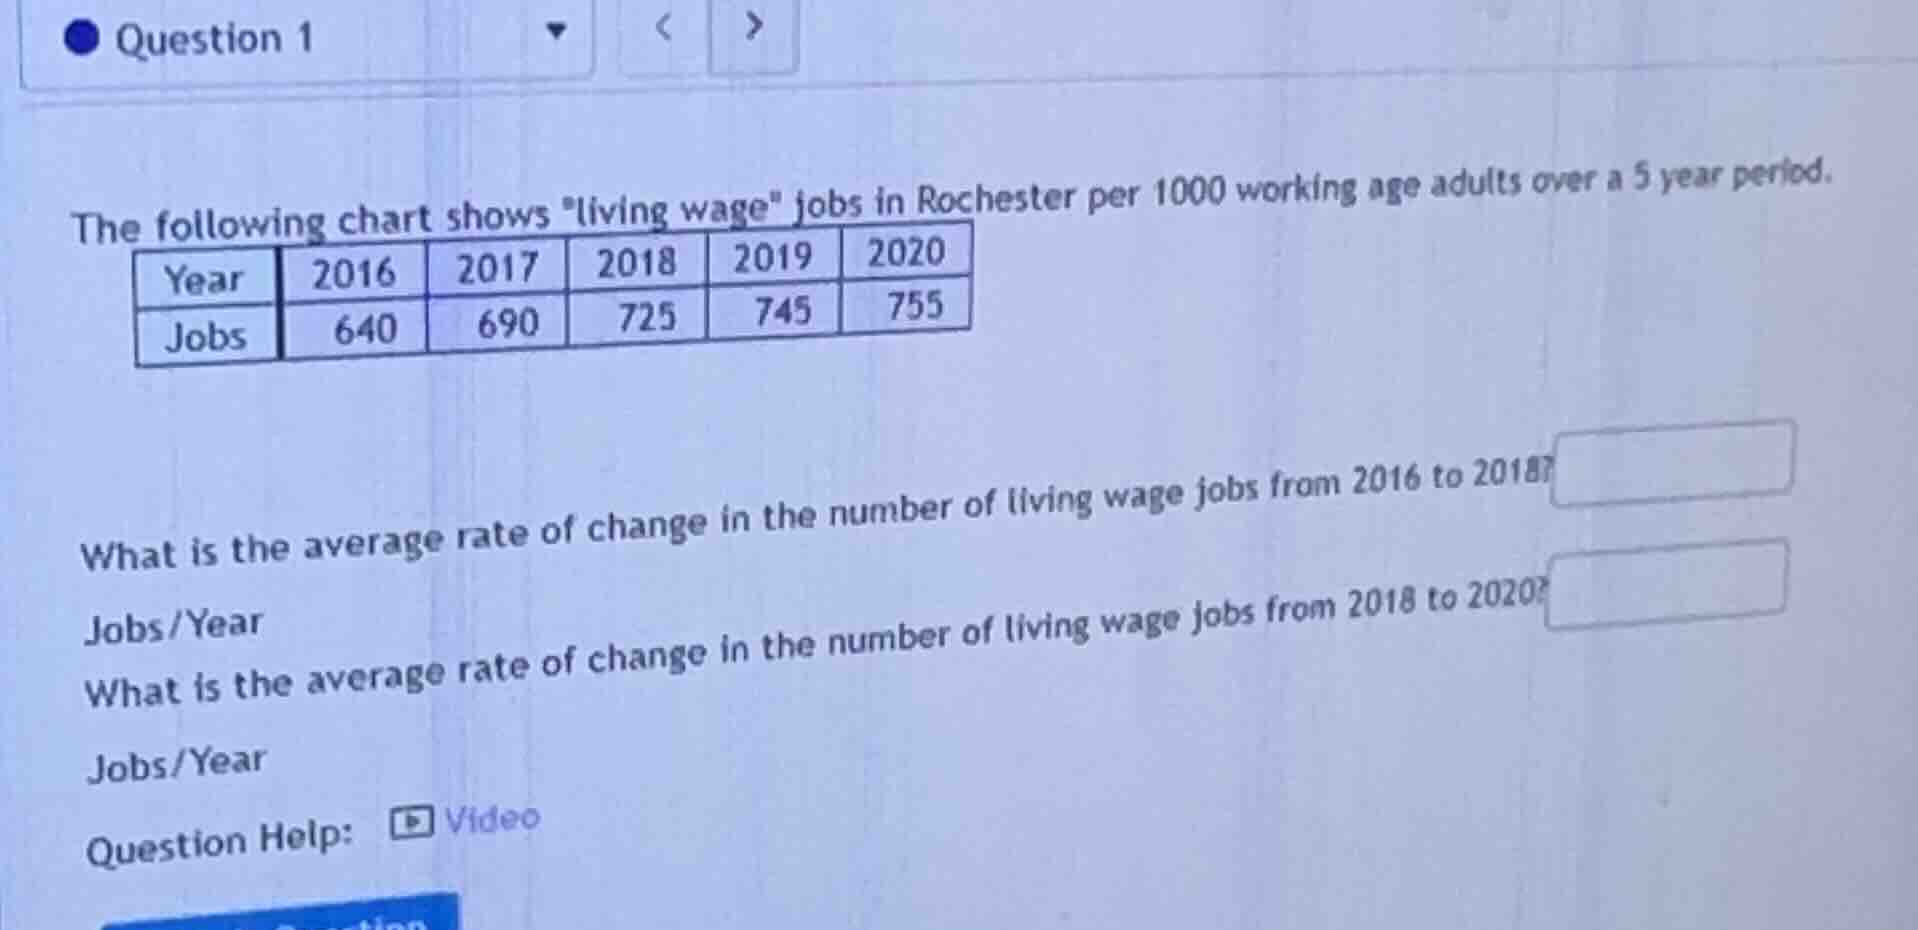
question 1 the following chart shows \living wage\ jobs in rochester per 1000 working age adults over a 5 year period. year 2016 2017 2018 2019 2020 jobs 640 690 725 745 755 what is the average rate of change in the number of living wage jobs from 2016 to 2018? jobs/year what is the average rate of change in the number of living wage jobs from 2018 to 2020? jobs/year question help: video
Part 1: Average rate of change from 2016 to 2018
Step 1: Identify values
For 2016, jobs = 640; for 2018, jobs = 725. Time difference: \(2018 - 2016 = 2\) years.
Step 2: Apply rate of change formula
The formula for average rate of change is \(\frac{\text{Change in Jobs}}{\text{Change in Years}}=\frac{725 - 640}{2018 - 2016}\)
Calculate numerator: \(725 - 640 = 85\)
Denominator: \(2018 - 2016 = 2\)
So, \(\frac{85}{2}=42.5\)
Part 2: Average rate of change from 2018 to 2020
Step 1: Identify values
For 2018, jobs = 725; for 2020, jobs = 755. Time difference: \(2020 - 2018 = 2\) years.
Step 2: Apply rate of change formula
Using \(\frac{\text{Change in Jobs}}{\text{Change in Years}}=\frac{755 - 725}{2020 - 2018}\)
Numerator: \(755 - 725 = 30\)
Denominator: \(2020 - 2018 = 2\)
So, \(\frac{30}{2}=15\)

Snap & solve any problem in the app
Get step-by-step solutions on Sovi AI
Photo-based solutions with guided steps
Explore more problems and detailed explanations
From 2016 to 2018: \(42.5\) Jobs/Year
From 2018 to 2020: \(15\) Jobs/Year