QUESTION IMAGE
Question
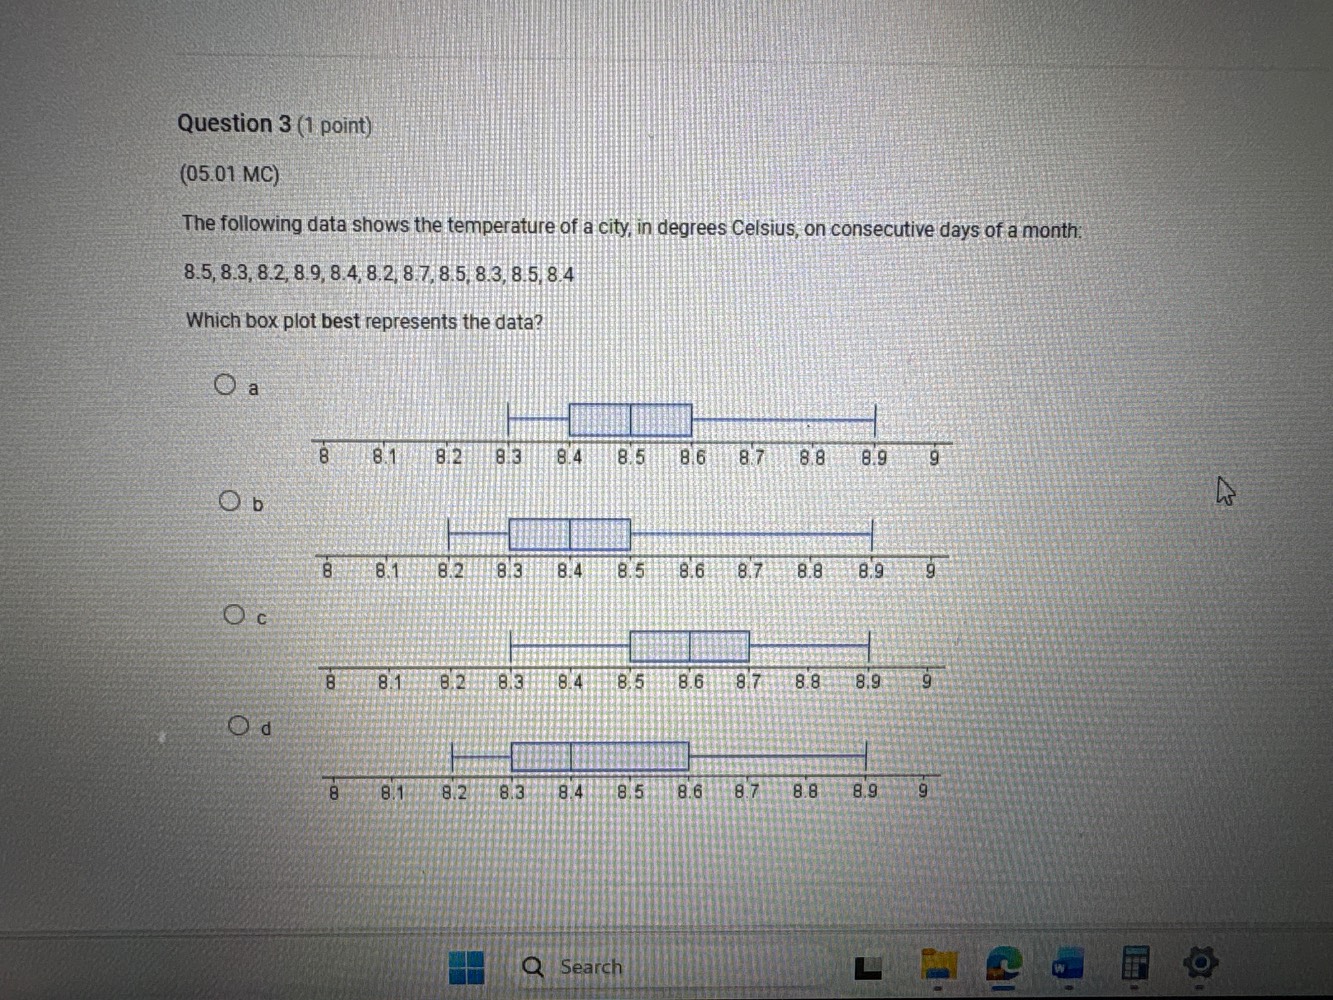
question 3 (1 point)(05.01 mc)the following data shows the temperature of a city, in degrees celsius, on consecutive days of a month:8.5, 8.3, 8.2, 8.9, 8.4, 8.2, 8.7, 8.5, 8.3, 8.5, 8.4which box plot best represents the data?abcd
Step1: Sort the data set
Sorted data: $8.2, 8.2, 8.3, 8.3, 8.4, 8.4, 8.5, 8.5, 8.5, 8.7, 8.9$
Step2: Find minimum and maximum
Minimum = $8.2$, Maximum = $8.9$
Step3: Calculate median (Q2)
Median is the 6th value: $8.4$
Step4: Calculate Q1 (lower median)
Lower half: $8.2, 8.2, 8.3, 8.3, 8.4$; Q1 = $8.3$
Step5: Calculate Q3 (upper median)
Upper half: $8.5, 8.5, 8.5, 8.7, 8.9$; Q3 = $8.5$
Step6: Match to box plot
Box plot has min=8.2, Q1=8.3, Q2=8.4, Q3=8.5, max=8.9

Snap & solve any problem in the app
Get step-by-step solutions on Sovi AI
Photo-based solutions with guided steps
Explore more problems and detailed explanations
b. The box plot with minimum at 8.2, Q1 at 8.3, median at 8.4, Q3 at 8.5, and maximum at 8.9