QUESTION IMAGE
Question
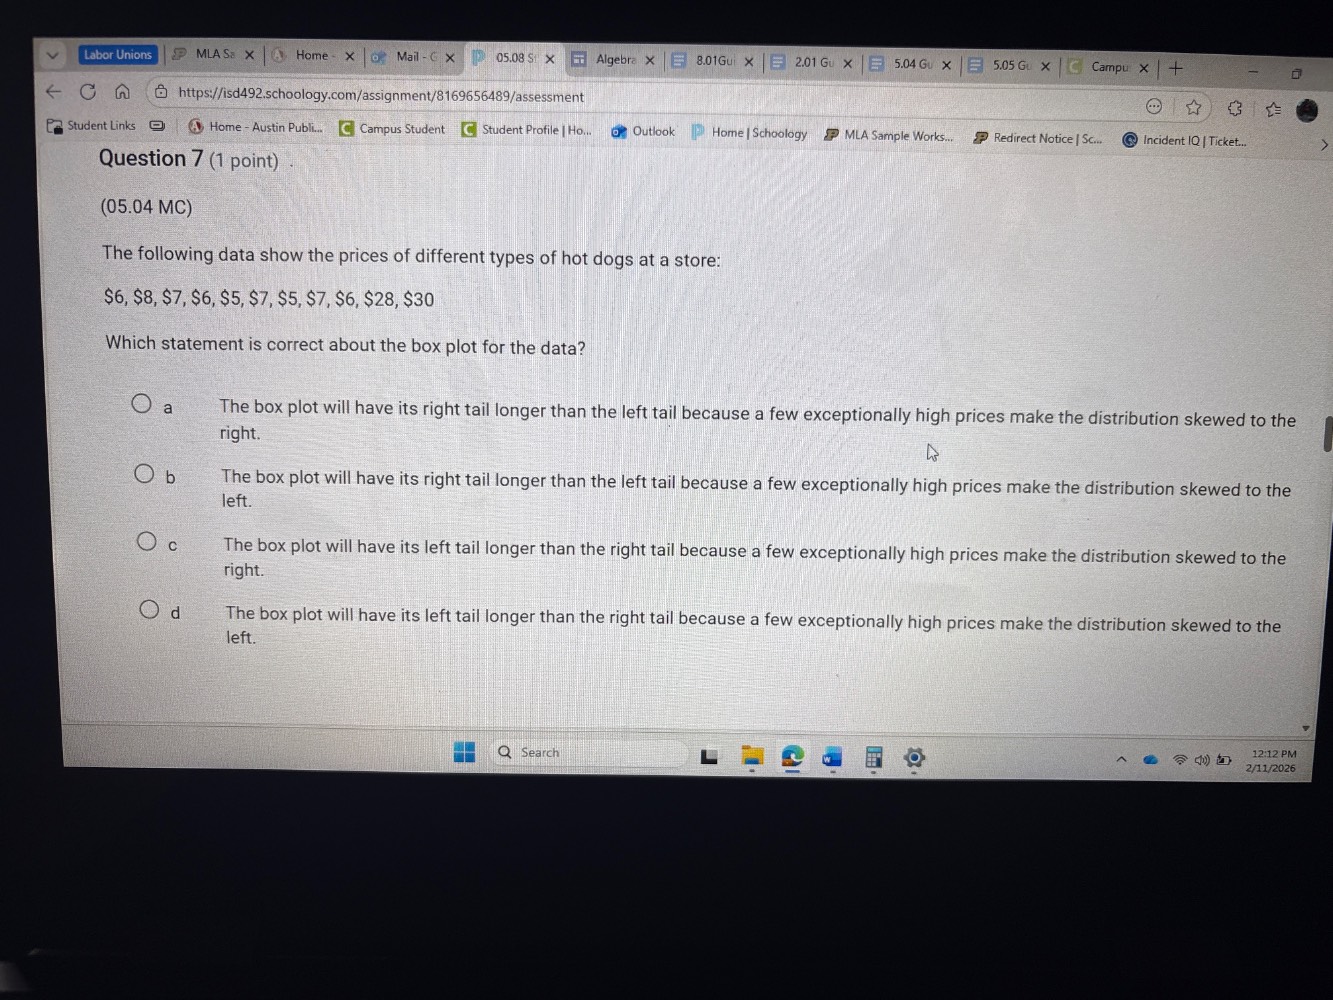
question 7 (1 point)(05.04 mc)the following data show the prices of different types of hot dogs at a store:$6, $8, $7, $6, $5, $7, $5, $7, $6, $28, $30which statement is correct about the box plot for the data?a the box plot will have its right tail longer than the left tail because a few exceptionally high prices make the distribution skewed to the right.b the box plot will have its right tail longer than the left tail because a few exceptionally high prices make the distribution skewed to the left.c the box plot will have its left tail longer than the right tail because a few exceptionally high prices make the distribution skewed to the right.d the box plot will have its left tail longer than the right tail because a few exceptionally high prices make the distribution skewed to the left.
First, identify outliers in the data: the values $28 and $30 are much higher than the rest of the prices (which range from $5 to $8). In a distribution, when there are a few exceptionally high values, the distribution is skewed to the right. For a right-skewed box plot, the right tail (extending towards higher values) is longer than the left tail.

Snap & solve any problem in the app
Get step-by-step solutions on Sovi AI
Photo-based solutions with guided steps
Explore more problems and detailed explanations
a. The box plot will have its right tail longer than the left tail because a few exceptionally high prices make the distribution skewed to the right.