QUESTION IMAGE
Question
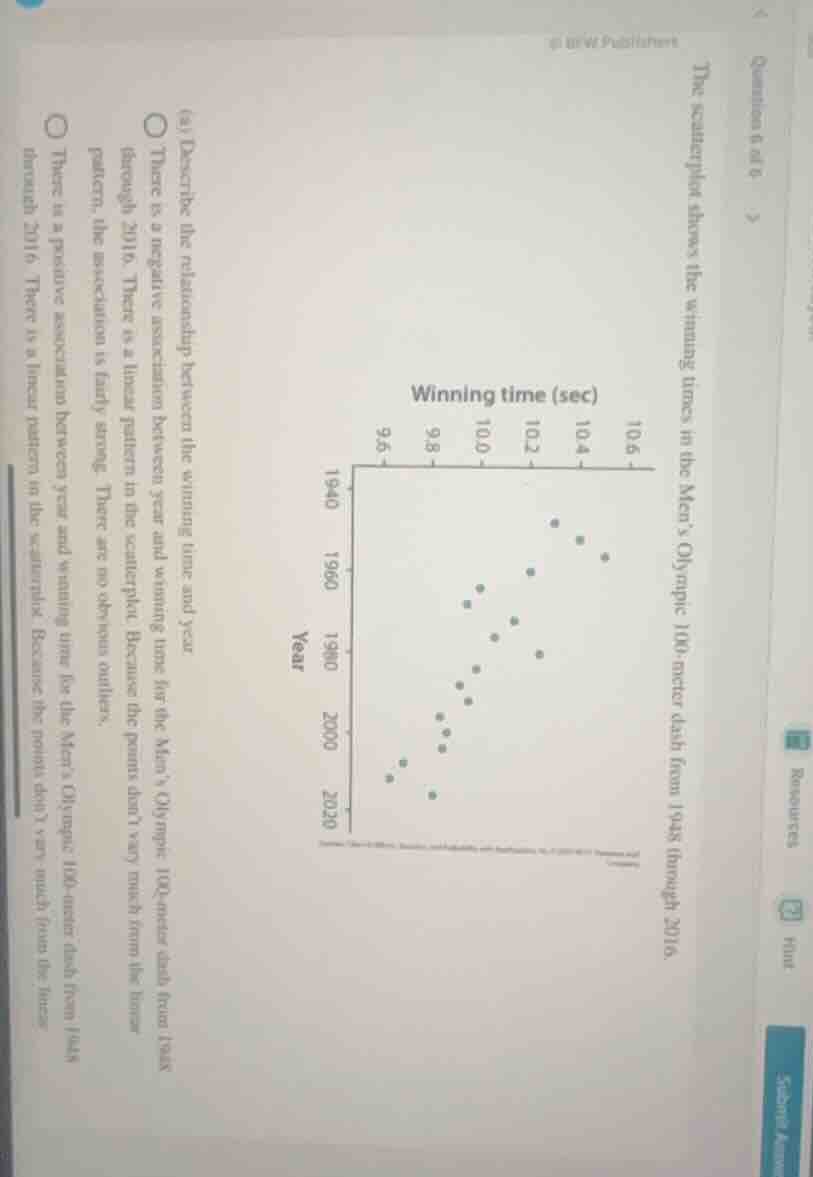
question 6 of 8 the scatterplot shows the winning times in the men’s olympic 100 - meter dash from 1948 through 2016. (a) describe the relationship between the winning time and year. there is a negative association between year and winning time for the men’s olympic 100 - meter dash from 1948 through 2016. there is a linear pattern in the scatterplot. because the points don’t vary much from the linear pattern, the association is fairly strong. there are no obvious outliers. there is a positive association between year and winning time for the men’s olympic 100 - meter dash from 1948 through 2016. there is a linear pattern in the scatterplot. because the points don’t vary much from the linear pattern, the association is fairly strong. there are no obvious outliers.
To determine the relationship between winning time and year from the scatterplot:
- Analyze Association Direction: As the year (x - axis) increases (from 1940 to 2016), the winning time (y - axis) generally decreases. This indicates a negative association (as one variable increases, the other tends to decrease).
- Analyze Linear Pattern: The points follow a roughly straight - line (linear) trend from the earlier years (higher winning times) to later years (lower winning times). There are no obvious outliers (points that deviate significantly from the general pattern).
So, the correct description is: "There is a negative association between year and winning time for the Men’s Olympic 100 - meter dash from 1948 through 2016. There is a linear pattern in the scatterplot. Because the points don’t vary much from the linear pattern, the association is fairly strong. There are no obvious outliers."

Snap & solve any problem in the app
Get step-by-step solutions on Sovi AI
Photo-based solutions with guided steps
Explore more problems and detailed explanations
There is a negative association between year and winning time for the Men’s Olympic 100 - meter dash from 1948 through 2016. There is a linear pattern in the scatterplot. Because the points don’t vary much from the linear pattern, the association is fairly strong. There are no obvious outliers.