QUESTION IMAGE
Question
question 3 of 9, step 1 of 2
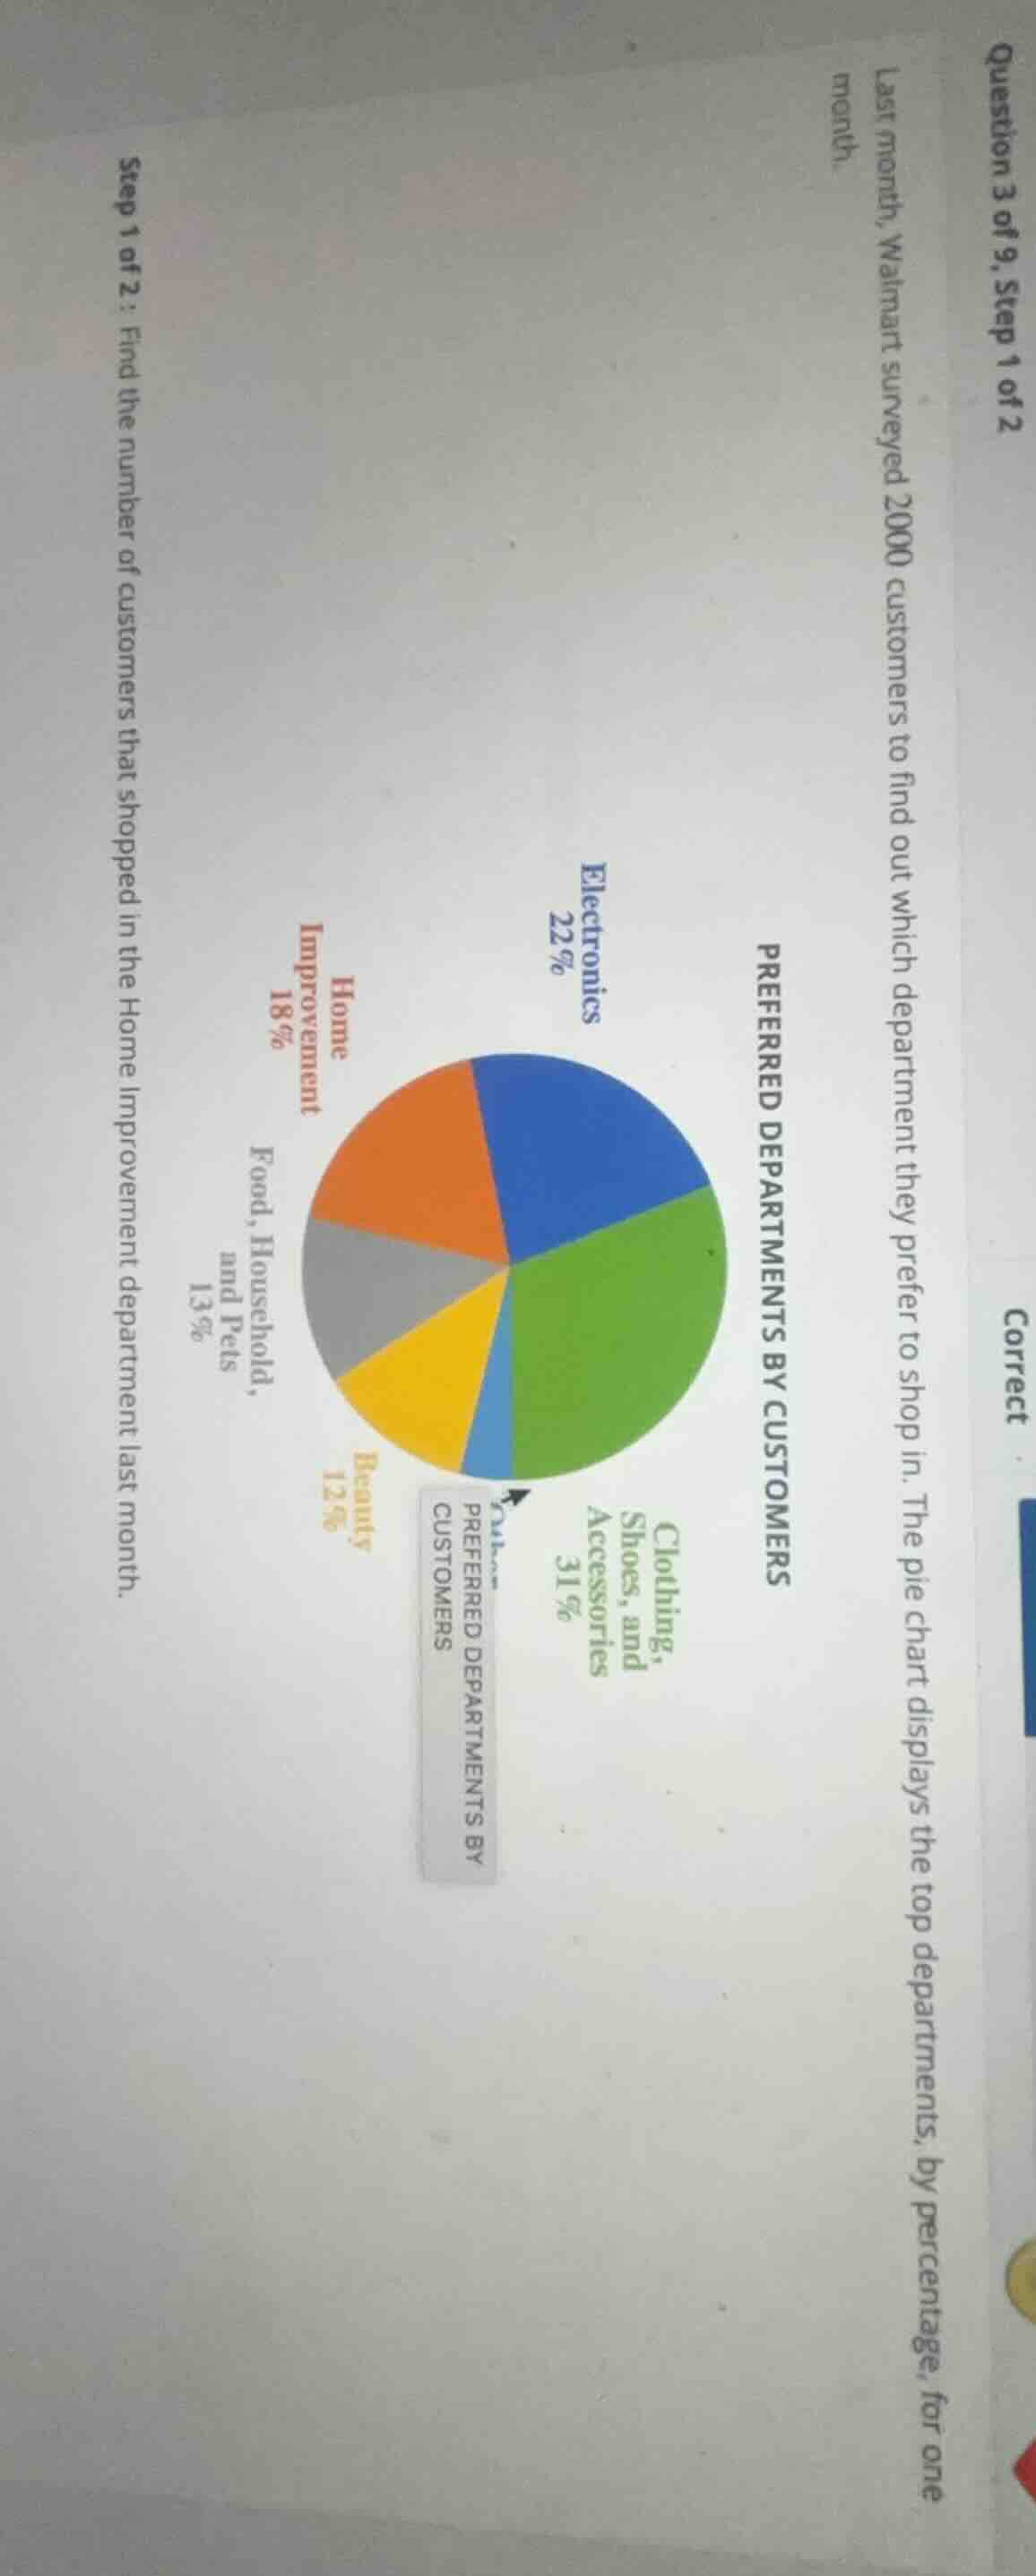
last month, walmart surveyed 2000 customers to find out which department they prefer to shop in. the pie chart displays the top departments, by percentage, for one month.
step 1 of 2: find the number of customers that shopped in the home improvement department last month.
preferred departments by customers
clothing, shoes, and accessories 31%
electronics 22%
home improvement 18%
food, household, and pets 13%
beauty 12%
other preferred departments by customers
Step1: Identify given values
Total customers = 2000, Home Improvement % = 18%
Step2: Calculate customer count
Multiply total by percentage: $2000 \times 0.18$

Snap & solve any problem in the app
Get step-by-step solutions on Sovi AI
Photo-based solutions with guided steps
Explore more problems and detailed explanations
360