QUESTION IMAGE
Question
question
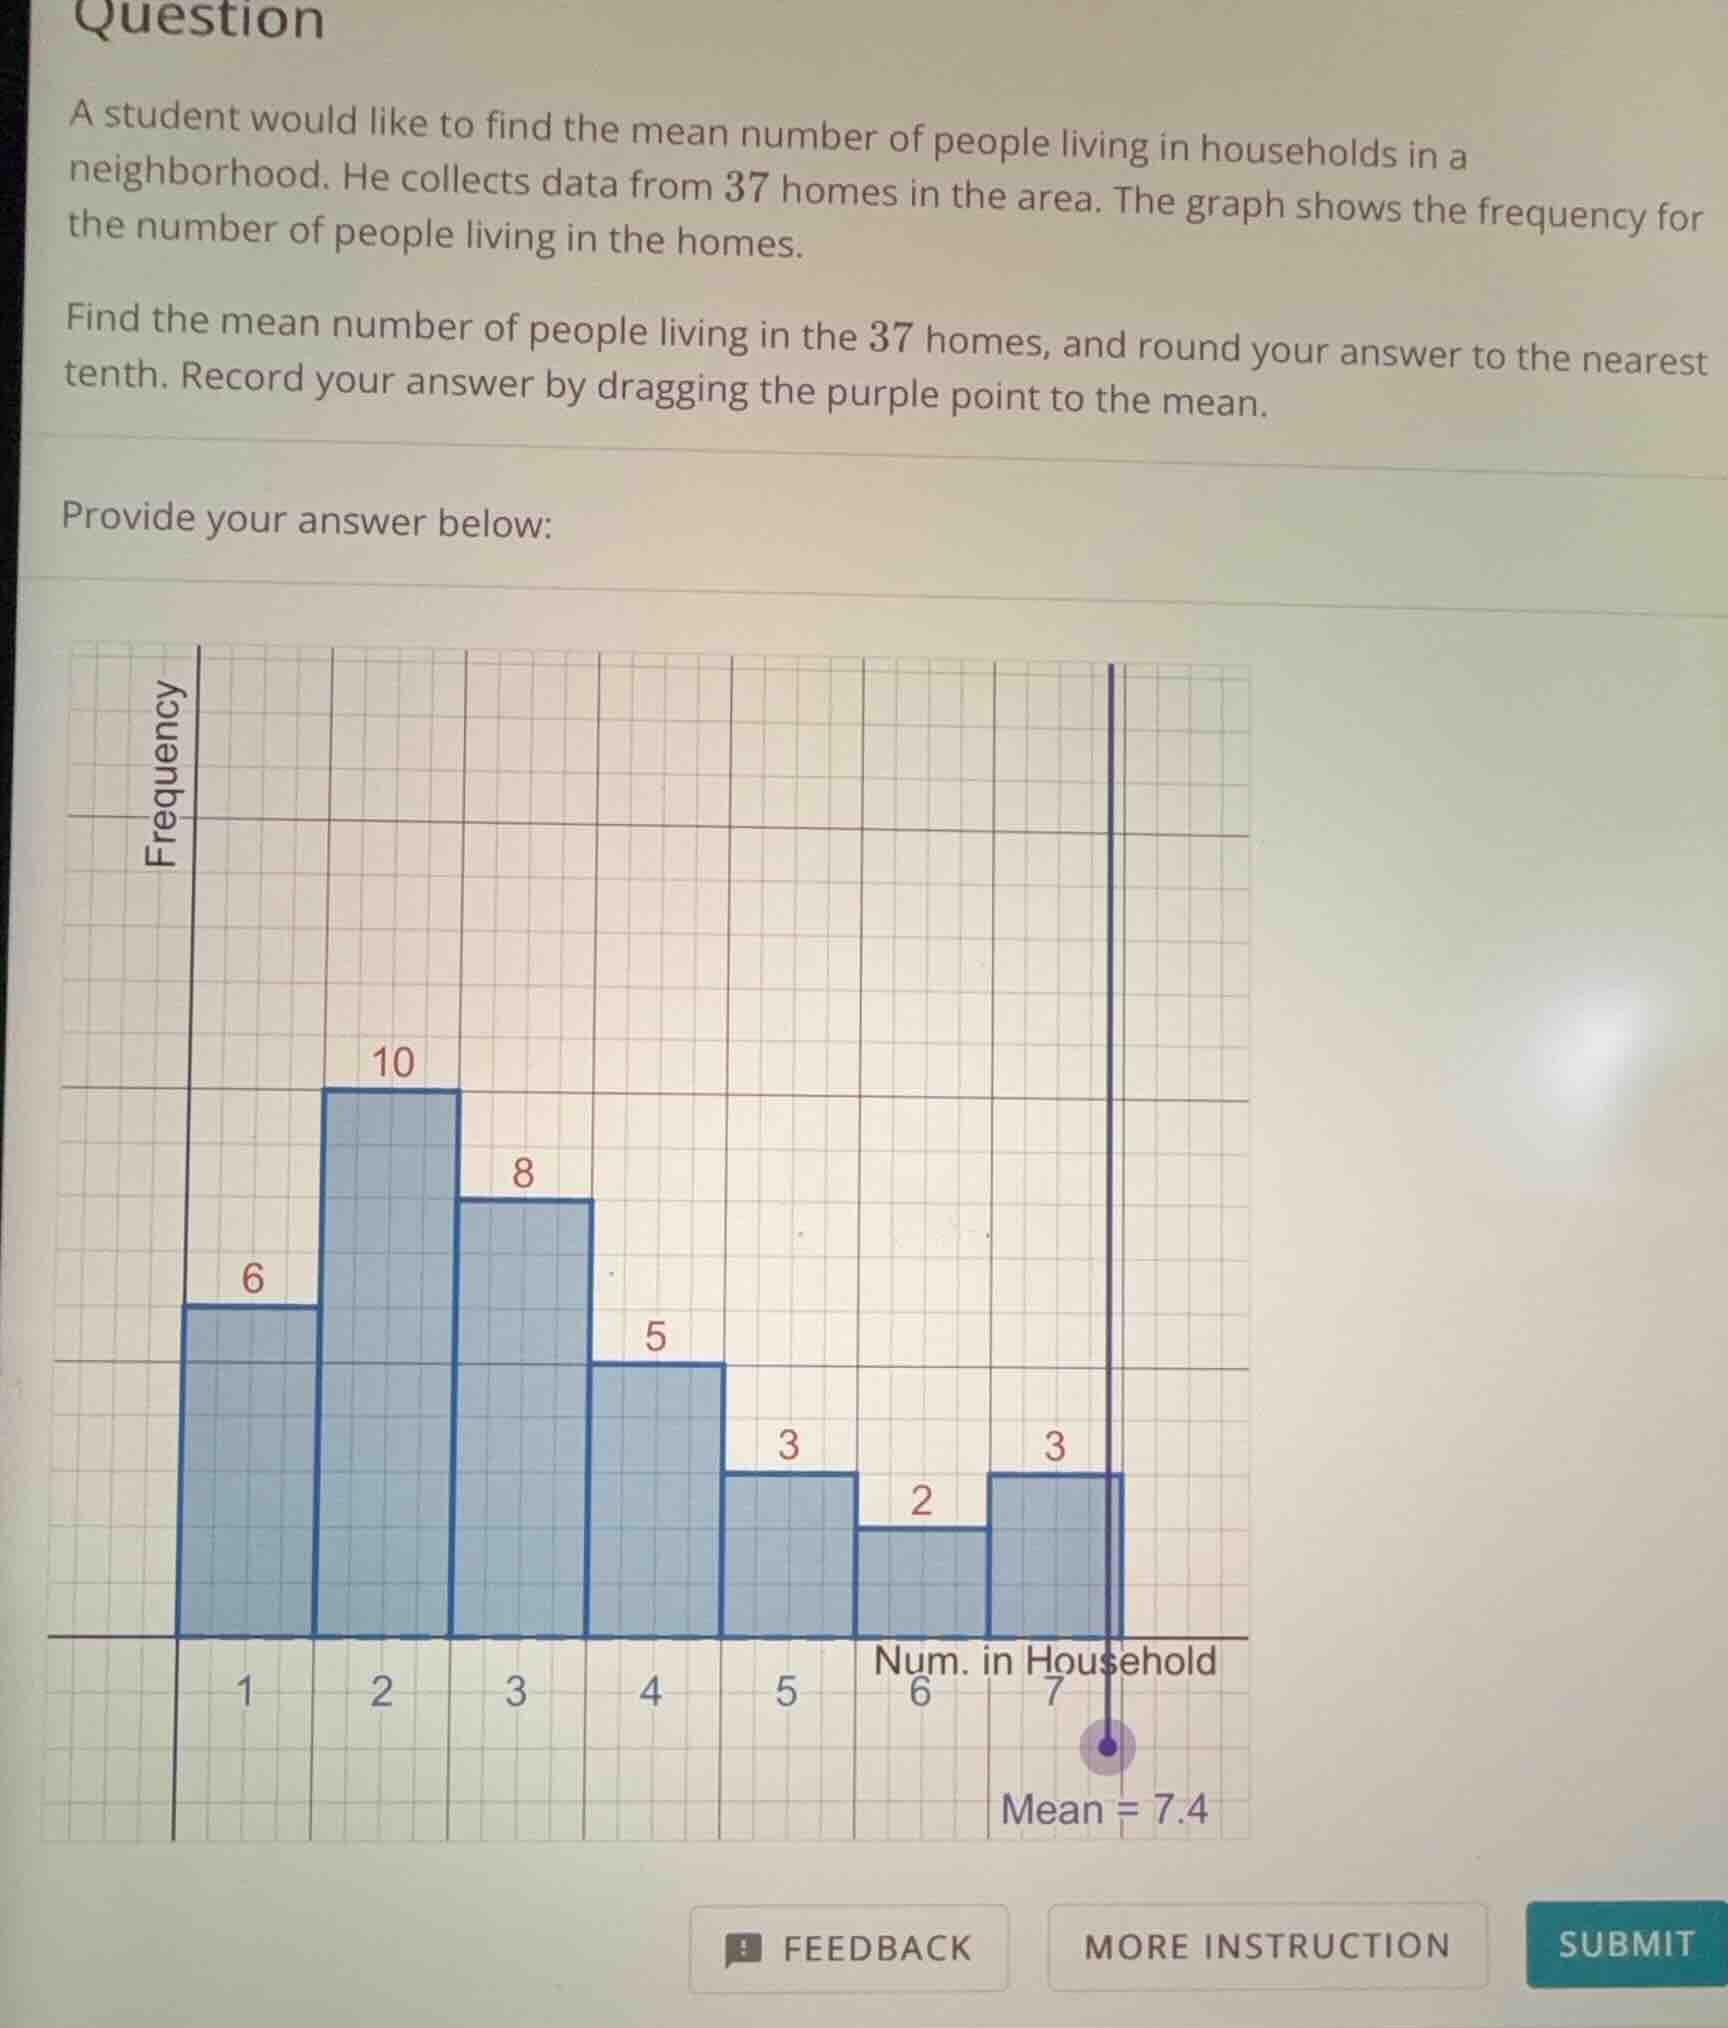
a student would like to find the mean number of people living in households in a neighborhood. he collects data from 37 homes in the area. the graph shows the frequency for the number of people living in the homes.
find the mean number of people living in the 37 homes, and round your answer to the nearest tenth. record your answer by dragging the purple point to the mean.
provide your answer below:
Step1: Calculate total people
For each number of people in household (\(x\)) and its frequency (\(f\)):
- \(x = 1\), \(f = 6\): \(1\times6 = 6\)
- \(x = 2\), \(f = 10\): \(2\times10 = 20\)
- \(x = 3\), \(f = 8\): \(3\times8 = 24\)
- \(x = 4\), \(f = 5\): \(4\times5 = 20\)
- \(x = 5\), \(f = 3\): \(5\times3 = 15\)
- \(x = 6\), \(f = 2\): \(6\times2 = 12\)
- \(x = 7\), \(f = 3\): \(7\times3 = 21\)
Sum these products: \(6 + 20 + 24 + 20 + 15 + 12 + 21 = 118\)
Step2: Calculate mean
Mean = \(\frac{\text{Total people}}{\text{Total homes}}=\frac{118}{37}\approx3.2\) (Wait, wait, no—wait, let's recalculate the total. Wait, 6+20=26, +24=50, +20=70, +15=85, +12=97, +21=118. Total homes: 6+10+8+5+3+2+3=37. So \(118\div37\approx3.2\)? Wait, but the graph's mean was shown as 7.4? Wait, no, I must have misread the x-axis. Wait, the x-axis is "Num. in Household"—wait, the bars are at 1,2,3,4,5,6,7. Wait, maybe I mixed up the x and f? Wait, no: the first bar is x=1, f=6; x=2, f=10; x=3, f=8; x=4, f=5; x=5, f=3; x=6, f=2; x=7, f=3. Wait, but 6+10+8+5+3+2+3=37, correct. Then total people: 16 + 210 + 38 + 45 + 53 + 62 + 7*3. Let's recalculate:
1*6 = 6
2*10 = 20 (total 26)
3*8 = 24 (total 50)
4*5 = 20 (total 70)
5*3 = 15 (total 85)
6*2 = 12 (total 97)
73 = 21 (total 118). 118 divided by 37: 373=111, 118-111=7, so 3 + 7/37≈3.189≈3.2. But the graph's purple point was at 7.4, which must be a mistake in my reading. Wait, no—wait, maybe the x-axis is reversed? Wait, no, the labels are 1,2,3,4,5,6,7. Wait, maybe the frequency is for higher numbers? Wait, no, the first bar (leftmost) is x=1, f=6. Wait, but the problem says "the mean number of people living in households"—usually, household size is around 2-5, but maybe the graph is mislabeled? Wait, no, let's check the total again. Wait, 6+10+8+5+3+2+3=37. Correct. Then 16 + 210 + 38 + 45 + 53 + 62 + 7*3 = 6+20+24+20+15+12+21=118. 118/37≈3.2. But the graph's mean was shown as 7.4, which is wrong. Wait, maybe I misread the frequencies. Wait, the first bar (x=1) has frequency 6? Wait, no, looking at the graph: the first bar (left) is at x=1, height 6; x=2, height 10; x=3, height 8; x=4, height 5; x=5, height 3; x=6, height 2; x=7, height 3. Yes. So the calculation is correct. So mean is 118/37≈3.2.
Wait, but the initial graph had a purple point at 7.4, which is incorrect. So let's do the calculation properly.
Total sum: \(1\times6 + 2\times10 + 3\times8 + 4\times5 + 5\times3 + 6\times2 + 7\times3\)
= \(6 + 20 + 24 + 20 + 15 + 12 + 21\)
= \(6+20=26; 26+24=50; 50+20=70; 70+15=85; 85+12=97; 97+21=118\)
Total number of homes: \(6+10+8+5+3+2+3=37\)
Mean = \(118\div37\approx3.2\) (rounded to nearest tenth)

Snap & solve any problem in the app
Get step-by-step solutions on Sovi AI
Photo-based solutions with guided steps
Explore more problems and detailed explanations
\(3.2\)