QUESTION IMAGE
Question
question 1
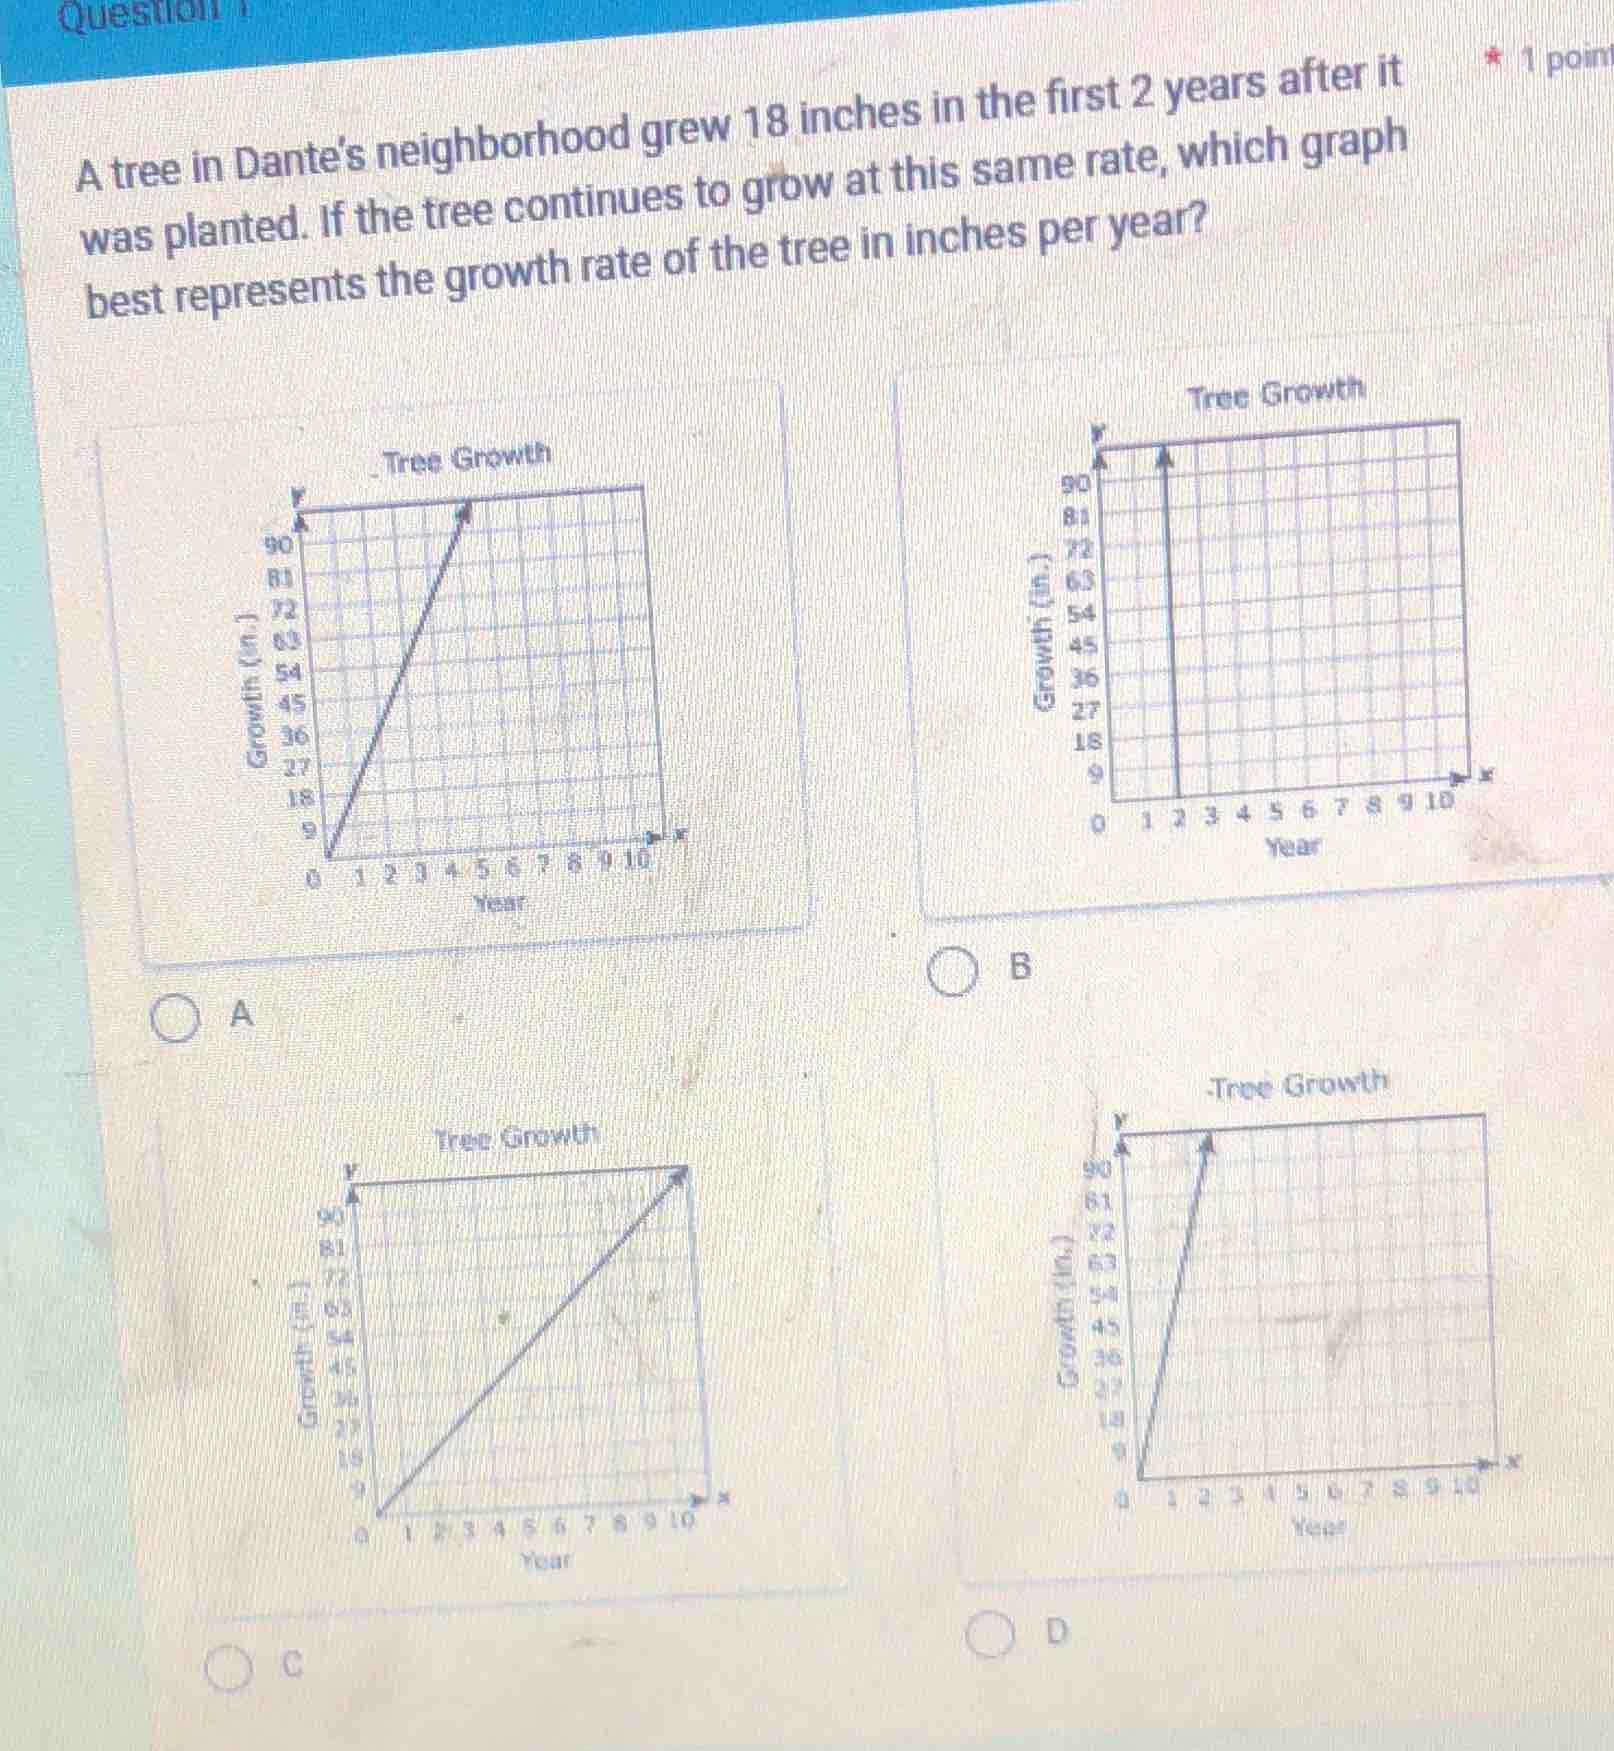
a tree in dantes neighborhood grew 18 inches in the first 2 years after it was planted. if the tree continues to grow at this same rate, which graph best represents the growth rate of the tree in inches per year?
a
b
c
d
Step1: Calculate annual growth rate
$\text{Annual growth rate} = \frac{18}{2} = 9$ inches/year
Step2: Find total growth in 10 years
$\text{Total growth} = 9 \times 10 = 90$ inches
Step3: Match to correct graph
The graph should show a straight line from (0,0) to (10,90), with a slope of 9. Graph A fits this: at year 2, growth is 18 inches, and it reaches 90 inches at year 10.

Snap & solve any problem in the app
Get step-by-step solutions on Sovi AI
Photo-based solutions with guided steps
Explore more problems and detailed explanations
A. Tree Growth graph with a straight line from (0,0) to (10,90)