QUESTION IMAGE
Question
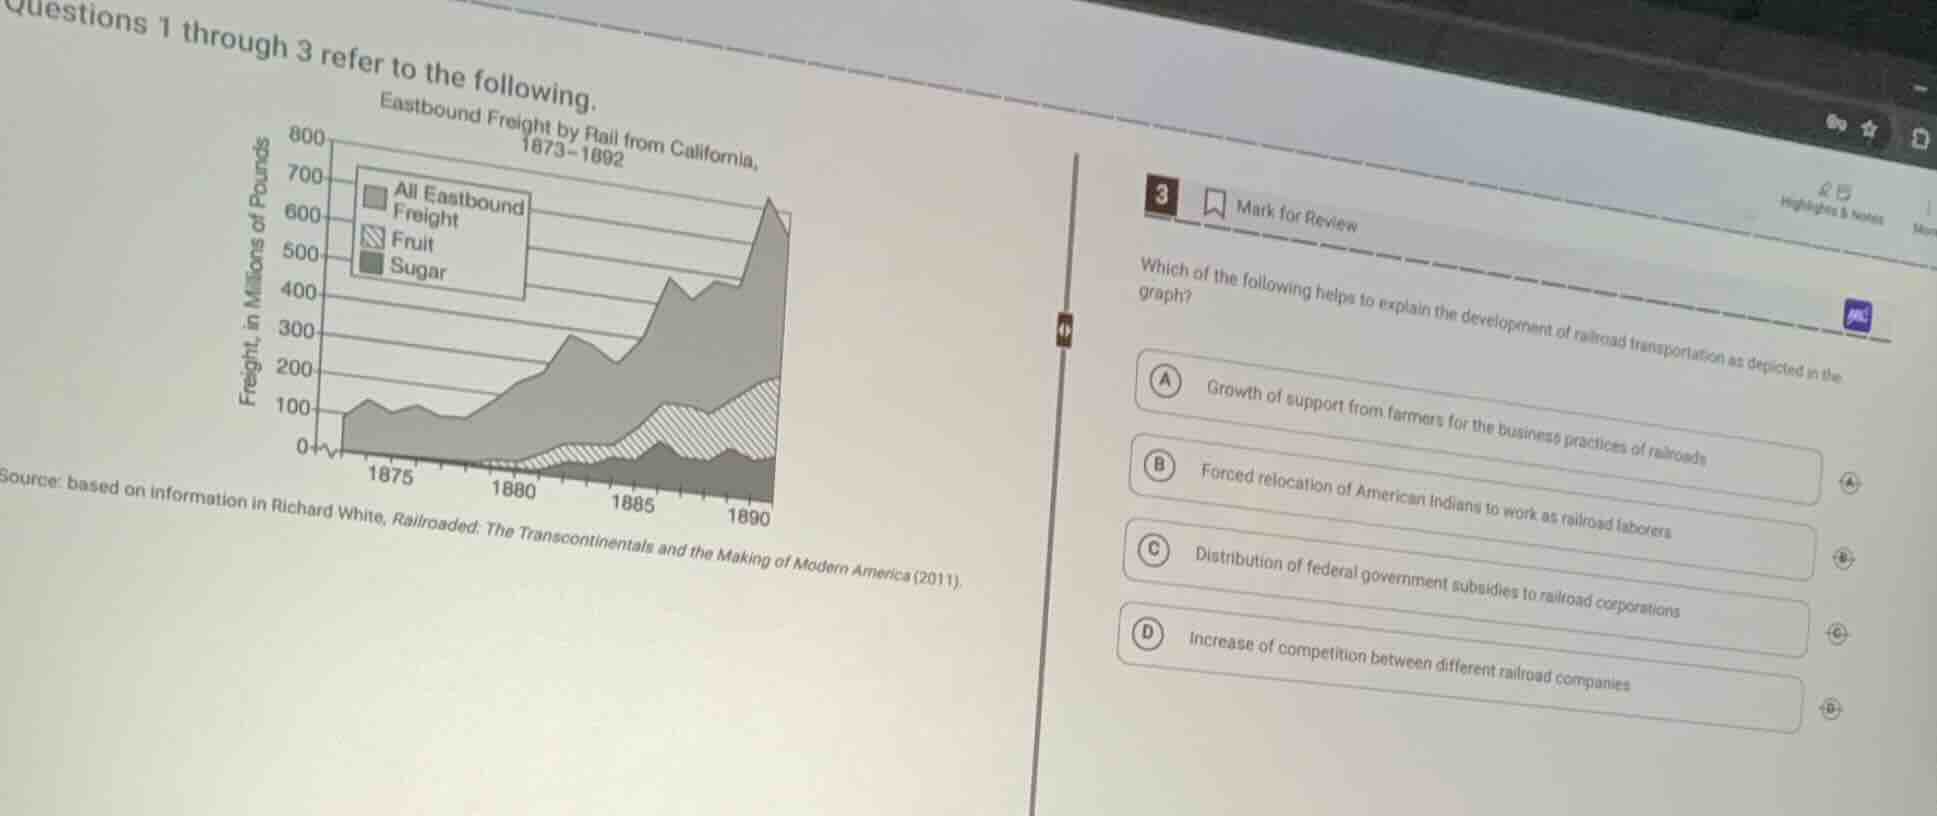
questions 1 through 3 refer to the following. eastbound freight by rail from california, 1873–1892 source: based on information in richard white, railroaded: the transcontinentals and the making of modern america (2011) 3 mark for review which of the following helps to explain the development of railroad transportation as depicted in the graph? (a) growth of support from farmers for the business practices of railroads (b) forced relocation of american indians to work as railroad laborers (c) distribution of federal government subsidies to railroad corporations (d) increase of competition between different railroad companies
To solve this, we analyze each option:
- Option A: Farmers often opposed railroad business practices (e.g., high rates), so this doesn't explain growth.
- Option B: Forced relocation of American Indians wasn't a main factor in railroad freight growth; labor for railroads was more about Chinese immigrants and others, not forced Indian labor for freight - related growth.
- Option C: The federal government gave subsidies (land grants, loans) to railroad corporations, which helped expand railroads. This expansion would allow more freight (like from California) to be transported, matching the graph's growth in eastbound freight.
- Option D: Increased competition between railroad companies doesn't directly explain the growth in freight volume; competition might affect rates but not the expansion of the rail network to carry more freight.

Snap & solve any problem in the app
Get step-by-step solutions on Sovi AI
Photo-based solutions with guided steps
Explore more problems and detailed explanations
C. Distribution of federal government subsidies to railroad corporations