QUESTION IMAGE
Question
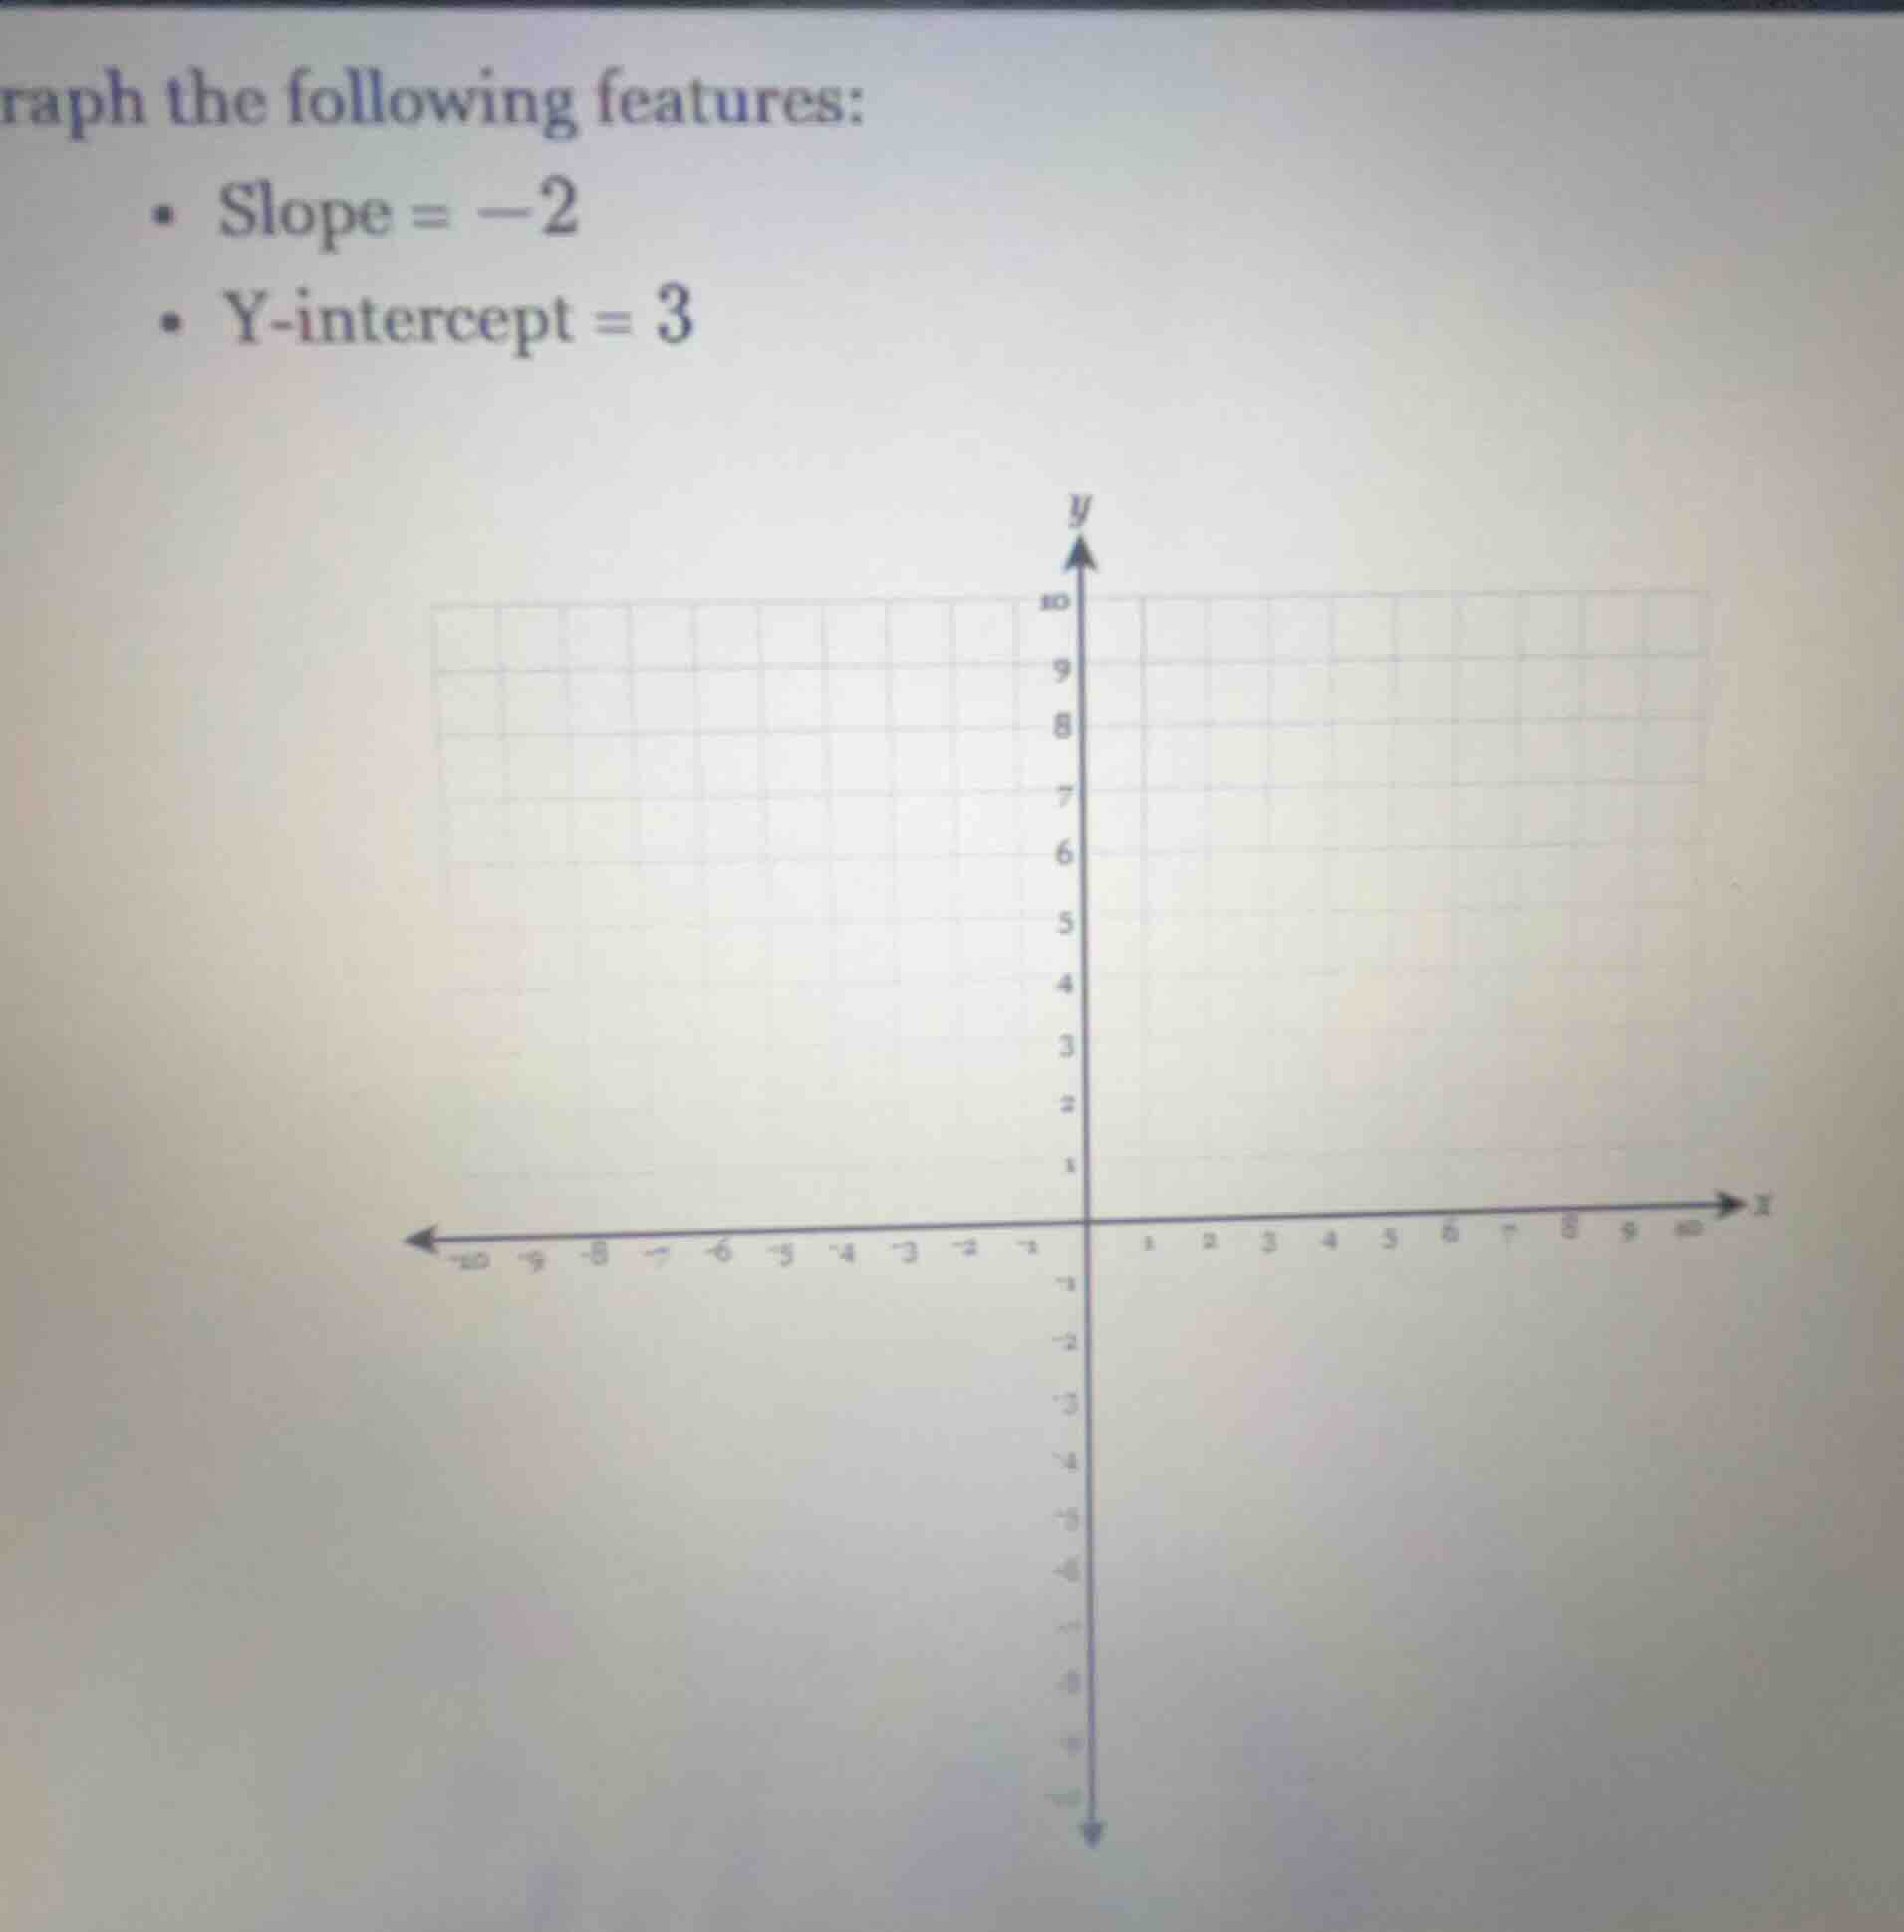
raph the following features: - slope = -2 - y-intercept = 3
Step1: Recall the slope - intercept form
The slope - intercept form of a linear equation is $y = mx + b$, where $m$ is the slope and $b$ is the y - intercept. Given that the slope $m=-2$ and the y - intercept $b = 3$, the equation of the line is $y=-2x + 3$.
Step2: Plot the y - intercept
The y - intercept is the point where the line crosses the y - axis. When $x = 0$, $y=3$. So we plot the point $(0,3)$ on the coordinate plane.
Step3: Use the slope to find another point
The slope $m=\frac{\text{rise}}{\text{run}}=-2=\frac{-2}{1}$. Starting from the point $(0,3)$, we move down 2 units (because the rise is - 2) and then 1 unit to the right (because the run is 1). This gives us the point $(0 + 1,3-2)=(1,1)$. We can also move up 2 units and left 1 unit from $(0,3)$ to get the point $(- 1,5)$ (since $\frac{2}{-1}=-2$).
Step4: Draw the line
Draw a straight line through the points that we have plotted (e.g., $(0,3)$ and $(1,1)$ or $(0,3)$ and $(-1,5)$) to represent the linear equation $y = - 2x+3$.
(Note: Since the question is about graphing, the final answer is the graph of the line $y=-2x + 3$ with a y - intercept at $(0,3)$ and a slope of - 2. If we were to describe the process of graphing in terms of the steps above, the key points are plotting $(0,3)$ and then using the slope to find additional points to draw the line.)

Snap & solve any problem in the app
Get step-by-step solutions on Sovi AI
Photo-based solutions with guided steps
Explore more problems and detailed explanations
The graph is a straight line with equation $y = - 2x+3$, passing through $(0,3)$ and other points determined by the slope (e.g., $(1,1)$) as described in the steps. To visualize, plot $(0,3)$, then from there, move 1 unit right and 2 units down to get $(1,1)$, and draw a line through these points.