QUESTION IMAGE
Question
read the passage and answer the following question(s).
passage 6449
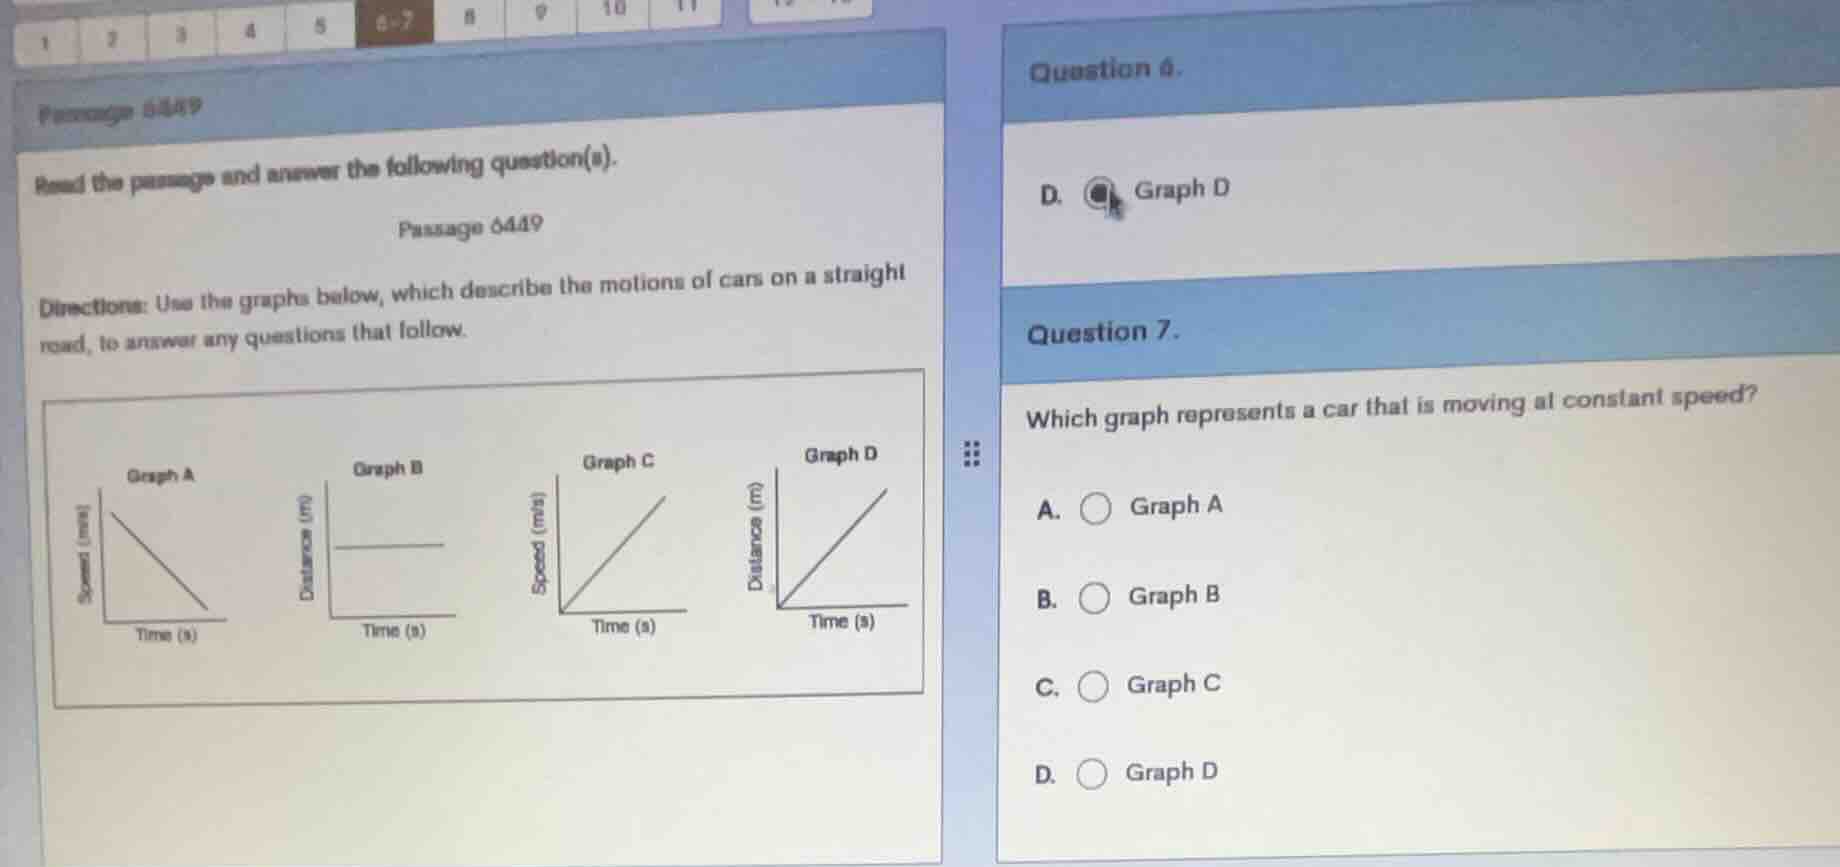
directions: use the graphs below, which describe the motions of cars on a straight road, to answer any questions that follow.
question 6.
d. graph d
question 7.
which graph represents a car that is moving at constant speed?
a. graph a
b. graph b
c. graph c
d. graph d
Brief Explanations
To determine which graph represents a car moving at constant speed, we analyze each graph:
- Graph A: Speed vs. Time graph with a decreasing line, so speed is changing (decelerating).
- Graph B: Distance vs. Time graph with a horizontal line, meaning distance is constant (car is stationary).
- Graph C: Speed vs. Time graph with an increasing line, so speed is changing (accelerating).
- Graph D: Distance vs. Time graph with a straight - line (linear) positive slope. The formula for speed is $v=\frac{d}{t}$, and for a linear distance - time graph ($d = vt$ where $v$ is constant), the slope represents speed. A constant slope means constant speed.

Snap & solve any problem in the app
Get step-by-step solutions on Sovi AI
Photo-based solutions with guided steps
Explore more problems and detailed explanations
D. Graph D