QUESTION IMAGE
Question
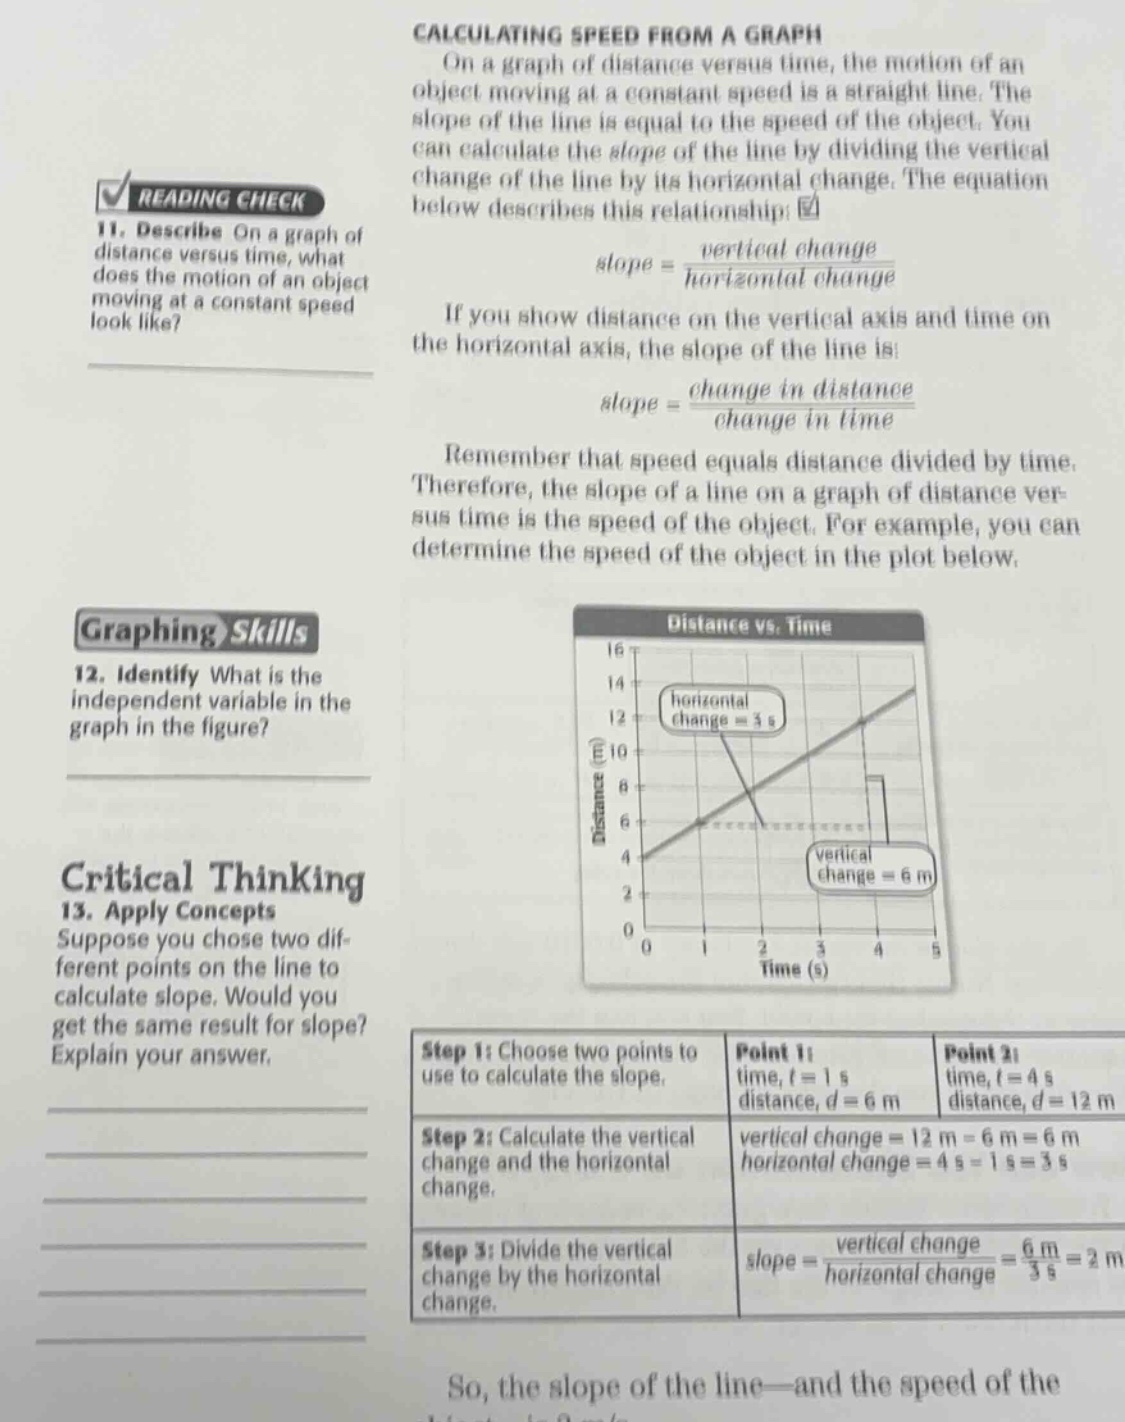
reading check 11. describe on a graph of distance versus time, what does the motion of an object moving at a constant speed look like? graphing skills 12. identify what is the independent variable in the graph in the figure? critical thinking 13. apply concepts suppose you chose two different points on the line to calculate slope. would you get the same result for slope? explain your answer. calculating speed from a graph on a graph of distance versus time, the motion of an object moving at a constant speed is a straight line. the slope of the line is equal to the speed of the object. you can calculate the slope of the line by dividing the vertical change of the line by its horizontal change. the equation below describes this relationship: \\(\text{slope} = \frac{\text{vertical change}}{\text{horizontal change}}\\) if you show distance on the vertical axis and time on the horizontal axis, the slope of the line is: \\(\text{slope} = \frac{\text{change in distance}}{\text{change in time}}\\) remember that speed equals distance divided by time. therefore, the slope of a line on a graph of distance versus time is the speed of the object. for example, you can determine the speed of the object in the plot below. distance vs. time graph with time (s) on x - axis and distance (m) on y - axis, horizontal change = 3 s, vertical change = 6 m, and a table with steps to calculate slope: step 1: choose two points to use to calculate the slope. point 1: time, \\(t = 1\\) s, distance, \\(d = 6\\) m; point 2: time, \\(t = 4\\) s, distance, \\(d = 12\\) m. step 2: calculate the vertical change and the horizontal change. vertical change = \\(12\\) m - \\(6\\) m = \\(6\\) m; horizontal change = \\(4\\) s - \\(1\\) s = \\(3\\) s. step 3: divide the vertical change by the horizontal change. \\(\text{slope} = \frac{\text{vertical change}}{\text{horizontal change}} = \frac{6\text{ m}}{3\text{ s}} = 2\text{ m/s}\\) so, the slope of the line—and the speed of the...
Question 11
The text states that on a distance - versus - time graph, an object moving at a constant speed has motion represented by a straight line. This is because the slope (which represents speed) is constant for such motion, and a constant slope on a graph of two variables (distance and time here) results in a straight - line graph.
In a graph, the independent variable is typically plotted on the horizontal (x - axis). In the "Distance vs. Time" graph, time is plotted on the horizontal axis. Also, by the definition of independent and dependent variables in the context of motion, time is the independent variable as distance depends on the time elapsed (distance = speed×time, and time progresses independently of the distance covered in the basic model of constant - speed motion).
- Recall the property of a straight line: A straight line has a constant slope. The formula for the slope between two points \((x_1,y_1)\) and \((x_2,y_2)\) is \(slope=\frac{y_2 - y_1}{x_2 - x_1}\).
- For a straight - line graph (which represents the motion of an object at constant speed), the ratio of the vertical change (change in distance) to the horizontal change (change in time) is constant everywhere on the line. This is because the speed (which is the slope) is constant. So, no matter which two points we choose on the line, when we calculate the slope (using the formula for slope between two points), we will get the same result.

Snap & solve any problem in the app
Get step-by-step solutions on Sovi AI
Photo-based solutions with guided steps
Explore more problems and detailed explanations
On a graph of distance versus time, the motion of an object moving at a constant speed looks like a straight line.