QUESTION IMAGE
Question
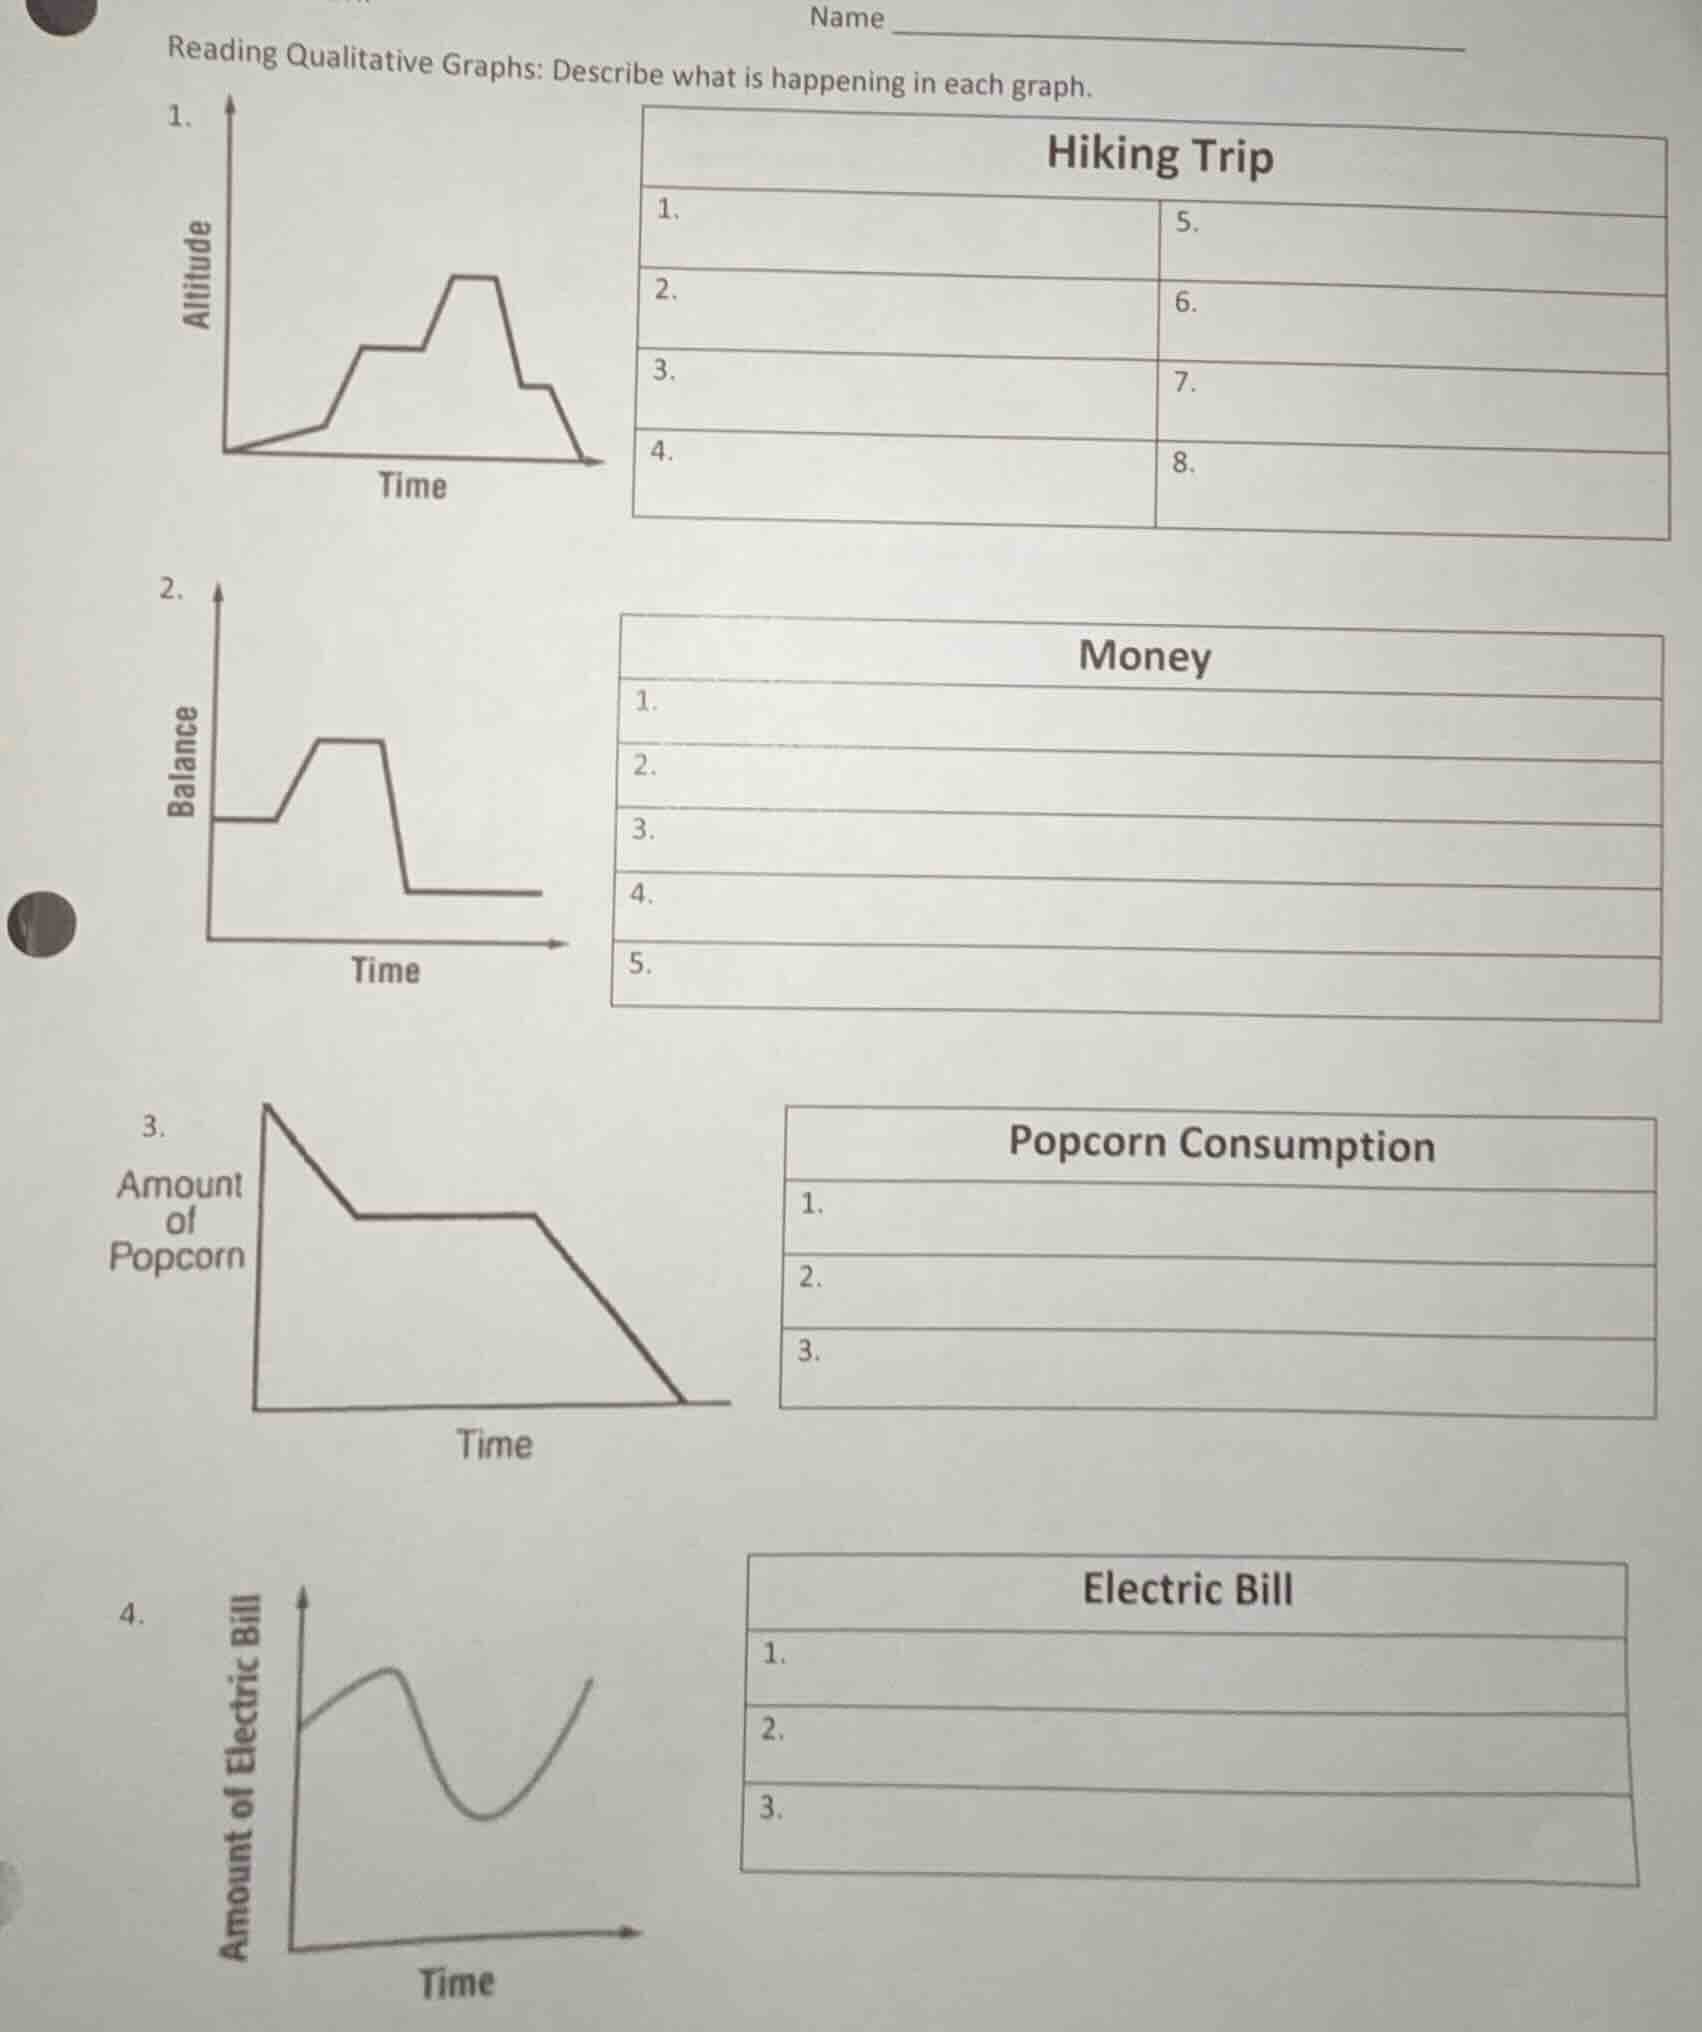
reading qualitative graphs: describe what is happening in each graph.
1.
2.
3.
4.
Response
1. Hiking Trip Graph (Altitude vs. Time)
Brief Explanations
- Initially, altitude increases slowly (start of hike, gradual ascent).
- Then, a steeper increase (faster ascent).
- A flat segment (resting or walking on flat terrain).
- Another steeper increase (climbing a peak).
- A flat segment (at the peak, resting).
- A steep decrease (descending from the peak).
- A less steep decrease (descending a bit slower).
- Finally, a steep decrease to zero (reaching the starting point or end of hike).
Brief Explanations
- Balance is constant initially (no transactions).
- Then, it increases (income or deposit).
- A flat segment (no transactions, holding balance).
- A steep decrease (large expense or withdrawal).
- Finally, balance remains constant (no further transactions).
Brief Explanations
- Amount of popcorn decreases steeply initially (fast consumption).
- Then, it remains constant (pause in eating).
- Finally, it decreases steeply to zero (finishing the popcorn).

Snap & solve any problem in the app
Get step-by-step solutions on Sovi AI
Photo-based solutions with guided steps
Explore more problems and detailed explanations
- Altitude starts increasing slowly.
- Altitude increases more steeply.
- Altitude remains constant (rest/flat terrain).
- Altitude increases steeply (climbing peak).
- Altitude remains constant (at peak).
- Altitude decreases steeply (descending peak).
- Altitude decreases less steeply.
- Altitude decreases steeply to zero (end hike).