QUESTION IMAGE
Question
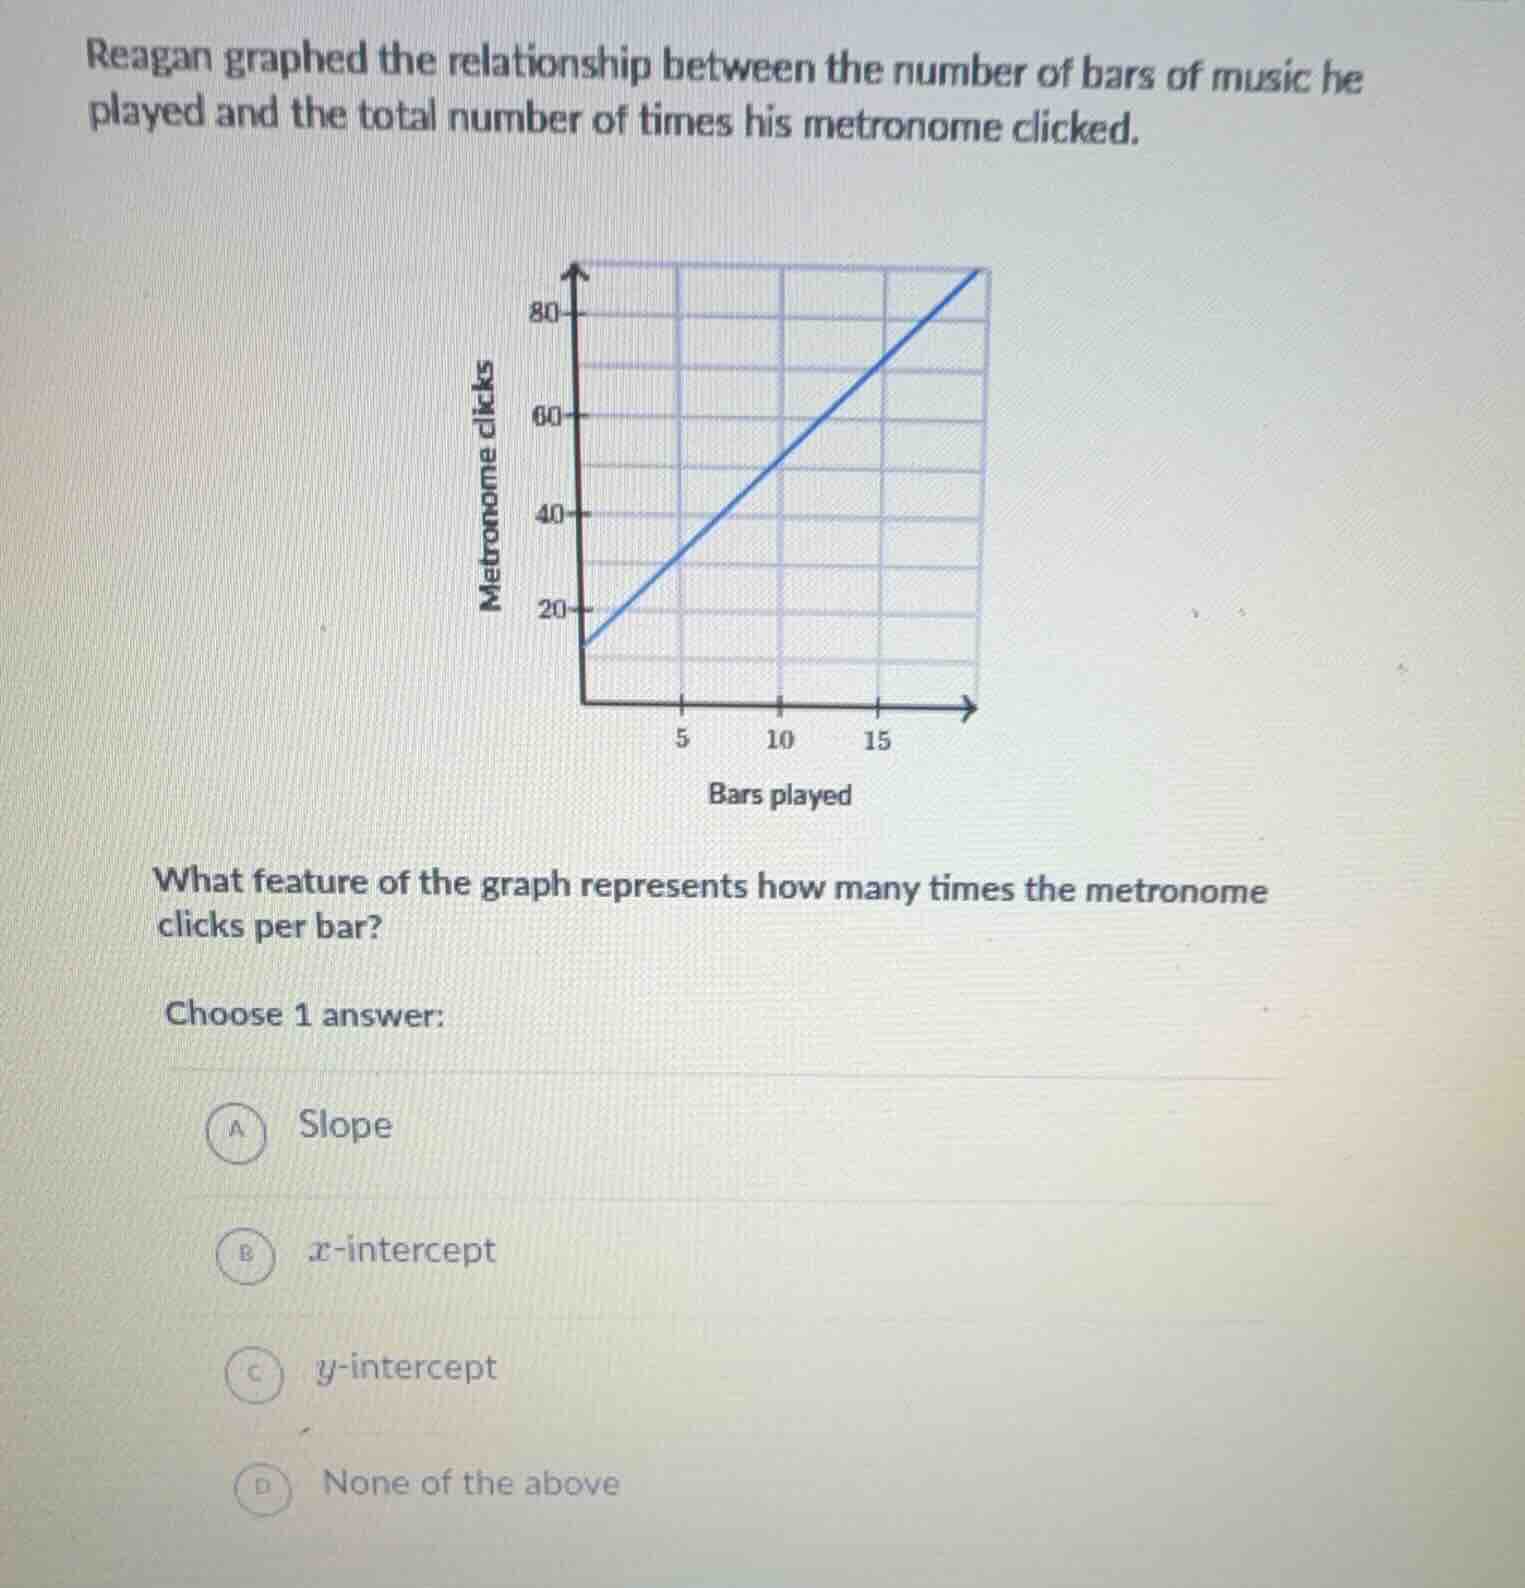
reagan graphed the relationship between the number of bars of music he played and the total number of times his metronome clicked.
what feature of the graph represents how many times the metronome clicks per bar?
choose 1 answer:
a slope
b $x$-intercept
c $y$-intercept
d none of the above
The slope of a linear graph represents the rate of change of the y-variable (metronome clicks) with respect to the x-variable (bars played). This rate is exactly the number of clicks per bar. The x-intercept is when clicks are 0, and the y-intercept is clicks at 0 bars, neither of which measure clicks per bar.

Snap & solve any problem in the app
Get step-by-step solutions on Sovi AI
Photo-based solutions with guided steps
Explore more problems and detailed explanations
A. Slope