QUESTION IMAGE
Question
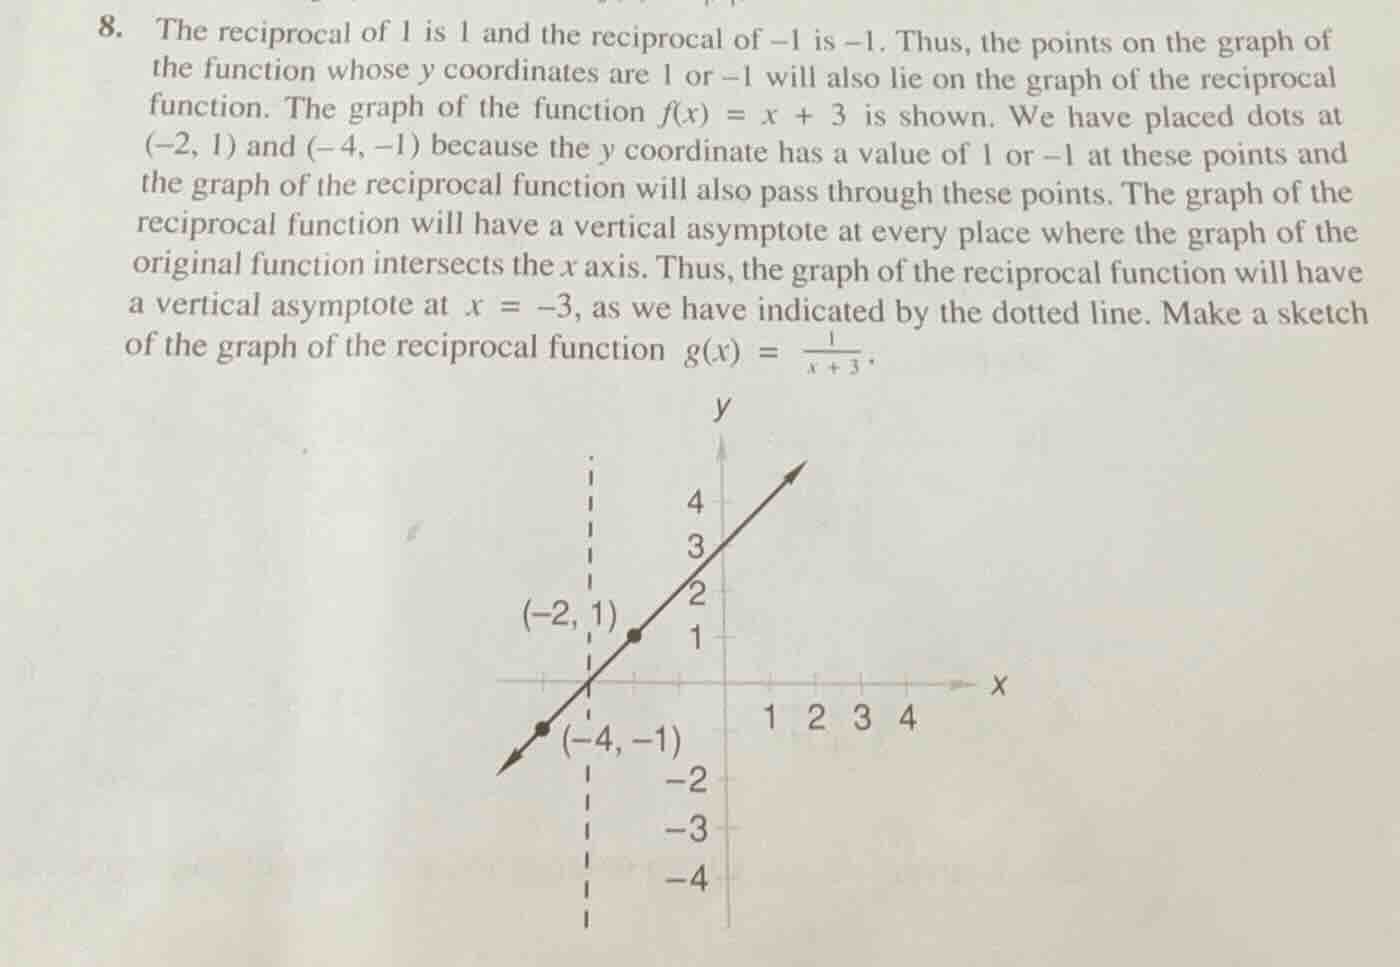
- the reciprocal of 1 is 1 and the reciprocal of -1 is -1. thus, the points on the graph of the function whose y coordinates are 1 or -1 will also lie on the graph of the reciprocal function. the graph of the function ( f(x) = x + 3 ) is shown. we have placed dots at ( (-2, 1) ) and ( (-4, -1) ) because the y coordinate has a value of 1 or -1 at these points and the graph of the reciprocal function will also pass through these points. the graph of the reciprocal function will have a vertical asymptote at every place where the graph of the original function intersects the x axis. thus, the graph of the reciprocal function will have a vertical asymptote at ( x = -3 ), as we have indicated by the dotted line. make a sketch of the graph of the reciprocal function ( g(x) = \frac{1}{x + 3} ).
Step1: Identify Key Features of Reciprocal Function
The reciprocal function is \( g(x)=\frac{1}{x + 3}\). For a reciprocal function of the form \(y=\frac{1}{x - h}+k\) (here \(h=- 3,k = 0\)), the vertical asymptote is at \(x=h\) (so \(x=-3\)) and horizontal asymptote is \(y = k\) (so \(y = 0\)). We also know two points \((-2,1)\) and \((-4,-1)\) lie on \(g(x)\) as given.
Step2: Analyze the Two Branches
- Right - hand branch ( \(x>-3\)): As \(x\) approaches \(-3\) from the right (\(x
ightarrow - 3^{+}\)), \(x + 3
ightarrow0^{+}\), so \(g(x)=\frac{1}{x + 3}
ightarrow+\infty\). As \(x
ightarrow+\infty\), \(x + 3
ightarrow+\infty\), so \(g(x)=\frac{1}{x + 3}
ightarrow0^{+}\). The point \((-2,1)\) is on this branch (\(x=-2>-3\)), so the right - hand branch passes through \((-2,1)\) and approaches \(x = - 3\) from the right (going up) and approaches \(y = 0\) as \(x
ightarrow+\infty\) (going down towards the x - axis).
- Left - hand branch ( \(x<-3\)): As \(x\) approaches \(-3\) from the left (\(x
ightarrow - 3^{-}\)), \(x + 3
ightarrow0^{-}\), so \(g(x)=\frac{1}{x + 3}
ightarrow-\infty\). As \(x
ightarrow-\infty\), \(x + 3
ightarrow-\infty\), so \(g(x)=\frac{1}{x + 3}
ightarrow0^{-}\). The point \((-4,-1)\) is on this branch (\(x=-4<-3\)), so the left - hand branch passes through \((-4,-1)\) and approaches \(x=-3\) from the left (going down) and approaches \(y = 0\) as \(x
ightarrow-\infty\) (going up towards the x - axis).
Step3: Sketch the Graph
- Draw the vertical asymptote \(x=-3\) (dotted line) and horizontal asymptote \(y = 0\) (the x - axis).
- Plot the points \((-2,1)\) and \((-4,-1)\).
- For the right - hand branch ( \(x>-3\)): Start near the vertical asymptote \(x=-3\) (above the x - axis, going up as \(x
ightarrow - 3^{+}\)) and pass through \((-2,1)\), then curve down towards the x - axis as \(x
ightarrow+\infty\).
- For the left - hand branch ( \(x<-3\)): Start near the vertical asymptote \(x=-3\) (below the x - axis, going down as \(x
ightarrow - 3^{-}\)) and pass through \((-4,-1)\), then curve up towards the x - axis as \(x
ightarrow-\infty\).

Snap & solve any problem in the app
Get step-by-step solutions on Sovi AI
Photo-based solutions with guided steps
Explore more problems and detailed explanations
The graph of \(g(x)=\frac{1}{x + 3}\) has a vertical asymptote at \(x=-3\), a horizontal asymptote at \(y = 0\), passes through \((-2,1)\) and \((-4,-1)\). The right - hand branch (for \(x>-3\)) approaches \(x=-3\) from the right (going to \(+\infty\)) and approaches \(y = 0\) as \(x
ightarrow+\infty\) (passing through \((-2,1)\)). The left - hand branch (for \(x<-3\)) approaches \(x=-3\) from the left (going to \(-\infty\)) and approaches \(y = 0\) as \(x
ightarrow-\infty\) (passing through \((-4,-1)\)). The sketch should show these two hyperbolic branches with the given asymptotes and points.