QUESTION IMAGE
Question
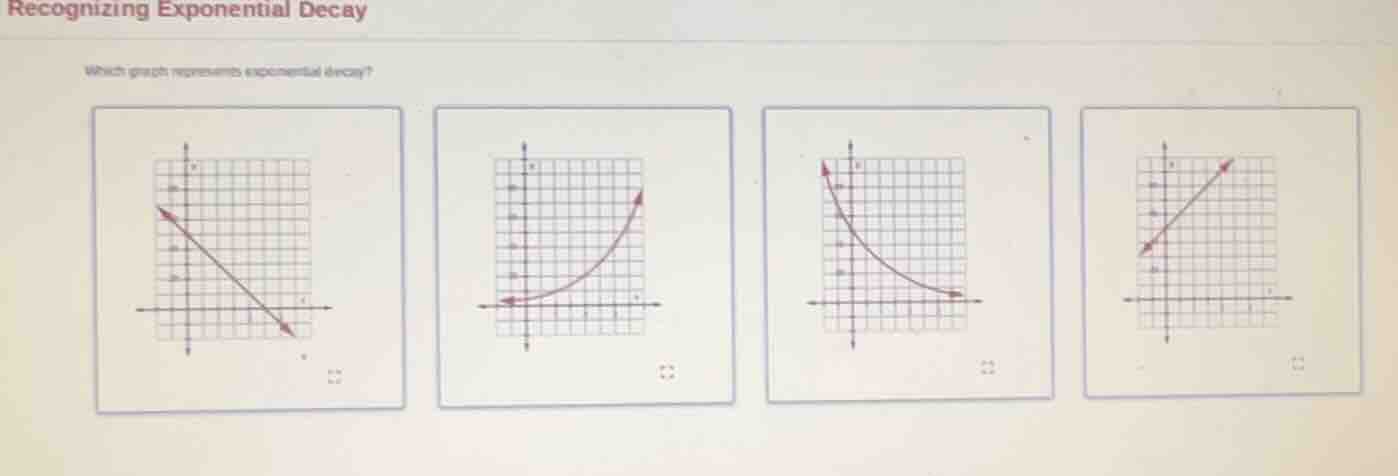
recognizing exponential decay
which graph represents exponential decay?
Brief Explanations
Exponential decay graphs are decreasing curves that approach a horizontal asymptote (usually the x-axis) as x increases, starting from a high value on the left. Linear graphs (first and fourth options) have constant slopes, not exponential behavior. The second graph shows exponential growth (increasing curve). The third graph matches the shape of exponential decay.

Snap & solve any problem in the app
Get step-by-step solutions on Sovi AI
Photo-based solutions with guided steps
Explore more problems and detailed explanations
The third graph (the decreasing curve that approaches the x-axis as x increases)