QUESTION IMAGE
Question
relative frequencies
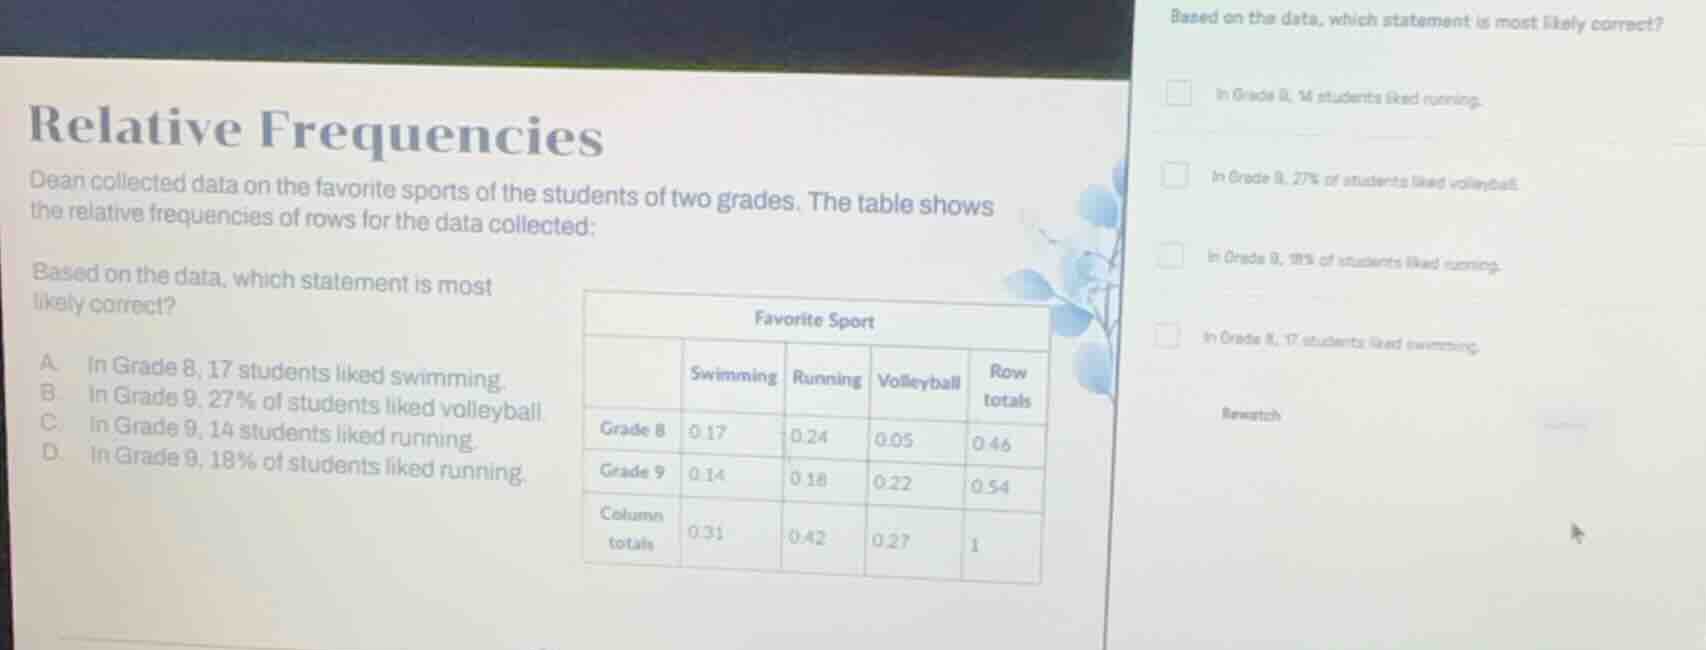
dean collected data on the favorite sports of the students of two grades. the table shows the relative frequencies of rows for the data collected:
based on the data, which statement is most likely correct?
a. in grade 8, 17 students liked swimming.
b. in grade 9, 27% of students liked volleyball
c. in grade 9, 14 students liked running.
d. in grade 9, 18% of students liked running.
favorite sport
| swimming | running | volleyball | row totals | |
|---|---|---|---|---|
| grade 9 | 0.14 | 0.18 | 0.22 | 0.54 |
| column totals | 0.31 | 0.42 | 0.27 | 1 |
Step1: Analyze row relative frequencies
Row relative frequencies represent the proportion of students in each grade who prefer a sport. For Grade 9, the relative frequency for running is given as $0.18$, which equals $18\%$.
Step2: Evaluate other options
- Option A: We only have the relative frequency ($0.17$) for Grade 8 swimming, no total student count, so we can't calculate the number of students.
- Option B: Grade 9 volleyball relative frequency is $0.22$ ($22\%$), not $27\%$.
- Option C: We only have the relative frequency ($0.18$) for Grade 9 running, no total student count, so we can't calculate the number of students.

Snap & solve any problem in the app
Get step-by-step solutions on Sovi AI
Photo-based solutions with guided steps
Explore more problems and detailed explanations
D. In Grade 9, 18% of students liked running.