QUESTION IMAGE
Question
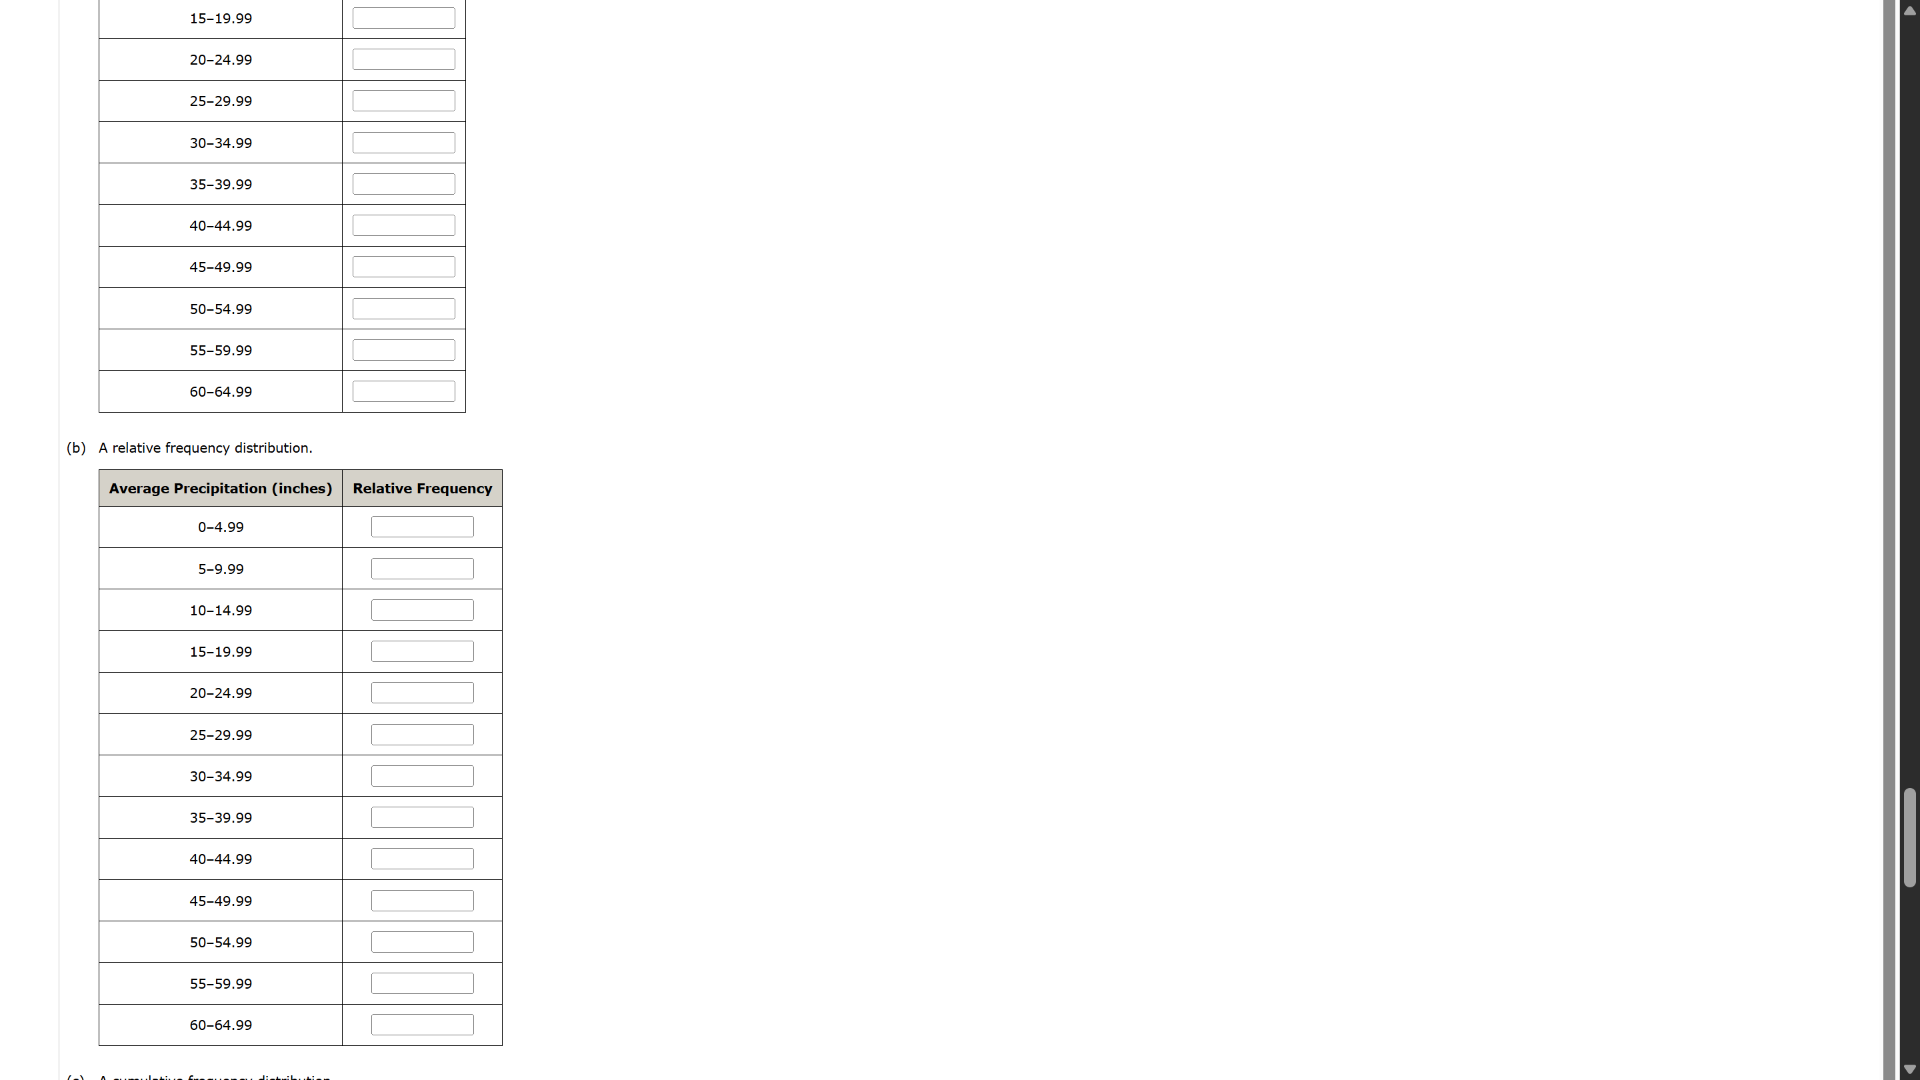
(b) a relative frequency distribution.
average precipitation (inches) relative frequency
0–4.99
5–9.99
10–14.99
15–19.99
20–24.99
25–29.99
30–34.99
35–39.99
40–44.99
45–49.99
50–54.99
55–59.99
60–64.99
To solve this, we need the frequency (number of observations) in each class interval. Since the frequencies are missing, we'll assume we have a dataset with total number of observations \( N \). The relative frequency for each class is calculated as \( \text{Relative Frequency} = \frac{\text{Frequency of the class}}{N} \).
Step 1: Obtain Frequencies
First, we need the frequency (count) of data points in each interval (e.g., 0–4.99, 5–9.99, etc.). Let’s denote the frequency of a class as \( f_i \) and the total number of observations as \( N \).
Step 2: Calculate Relative Frequency
For each class interval, compute:
\[
\text{Relative Frequency}_i = \frac{f_i}{N}
\]
Example (If Frequencies Were Given)
Suppose we have a dataset with \( N = 100 \) and frequencies:
- 0–4.99: \( f_1 = 10 \)
- 5–9.99: \( f_2 = 15 \)
- 10–14.99: \( f_3 = 20 \)
-... (and so on for other classes)
Then:
- Relative Frequency for 0–4.99: \( \frac{10}{100} = 0.10 \)
- Relative Frequency for 5–9.99: \( \frac{15}{100} = 0.15 \)
-...
Final Answer
To complete the relative frequency distribution, follow these steps:
- Count the frequency (\( f_i \)) of each class interval.
- Divide each \( f_i \) by the total number of observations (\( N \)) to get the relative frequency.
If you provide the frequencies or the dataset, we can compute the exact relative frequencies. For now, the formula to use is \( \text{Relative Frequency} = \frac{\text{Frequency of the class}}{\text{Total number of observations}} \).

Snap & solve any problem in the app
Get step-by-step solutions on Sovi AI
Photo-based solutions with guided steps
Explore more problems and detailed explanations
To solve this, we need the frequency (number of observations) in each class interval. Since the frequencies are missing, we'll assume we have a dataset with total number of observations \( N \). The relative frequency for each class is calculated as \( \text{Relative Frequency} = \frac{\text{Frequency of the class}}{N} \).
Step 1: Obtain Frequencies
First, we need the frequency (count) of data points in each interval (e.g., 0–4.99, 5–9.99, etc.). Let’s denote the frequency of a class as \( f_i \) and the total number of observations as \( N \).
Step 2: Calculate Relative Frequency
For each class interval, compute:
\[
\text{Relative Frequency}_i = \frac{f_i}{N}
\]
Example (If Frequencies Were Given)
Suppose we have a dataset with \( N = 100 \) and frequencies:
- 0–4.99: \( f_1 = 10 \)
- 5–9.99: \( f_2 = 15 \)
- 10–14.99: \( f_3 = 20 \)
-... (and so on for other classes)
Then:
- Relative Frequency for 0–4.99: \( \frac{10}{100} = 0.10 \)
- Relative Frequency for 5–9.99: \( \frac{15}{100} = 0.15 \)
-...
Final Answer
To complete the relative frequency distribution, follow these steps:
- Count the frequency (\( f_i \)) of each class interval.
- Divide each \( f_i \) by the total number of observations (\( N \)) to get the relative frequency.
If you provide the frequencies or the dataset, we can compute the exact relative frequencies. For now, the formula to use is \( \text{Relative Frequency} = \frac{\text{Frequency of the class}}{\text{Total number of observations}} \).