QUESTION IMAGE
Question
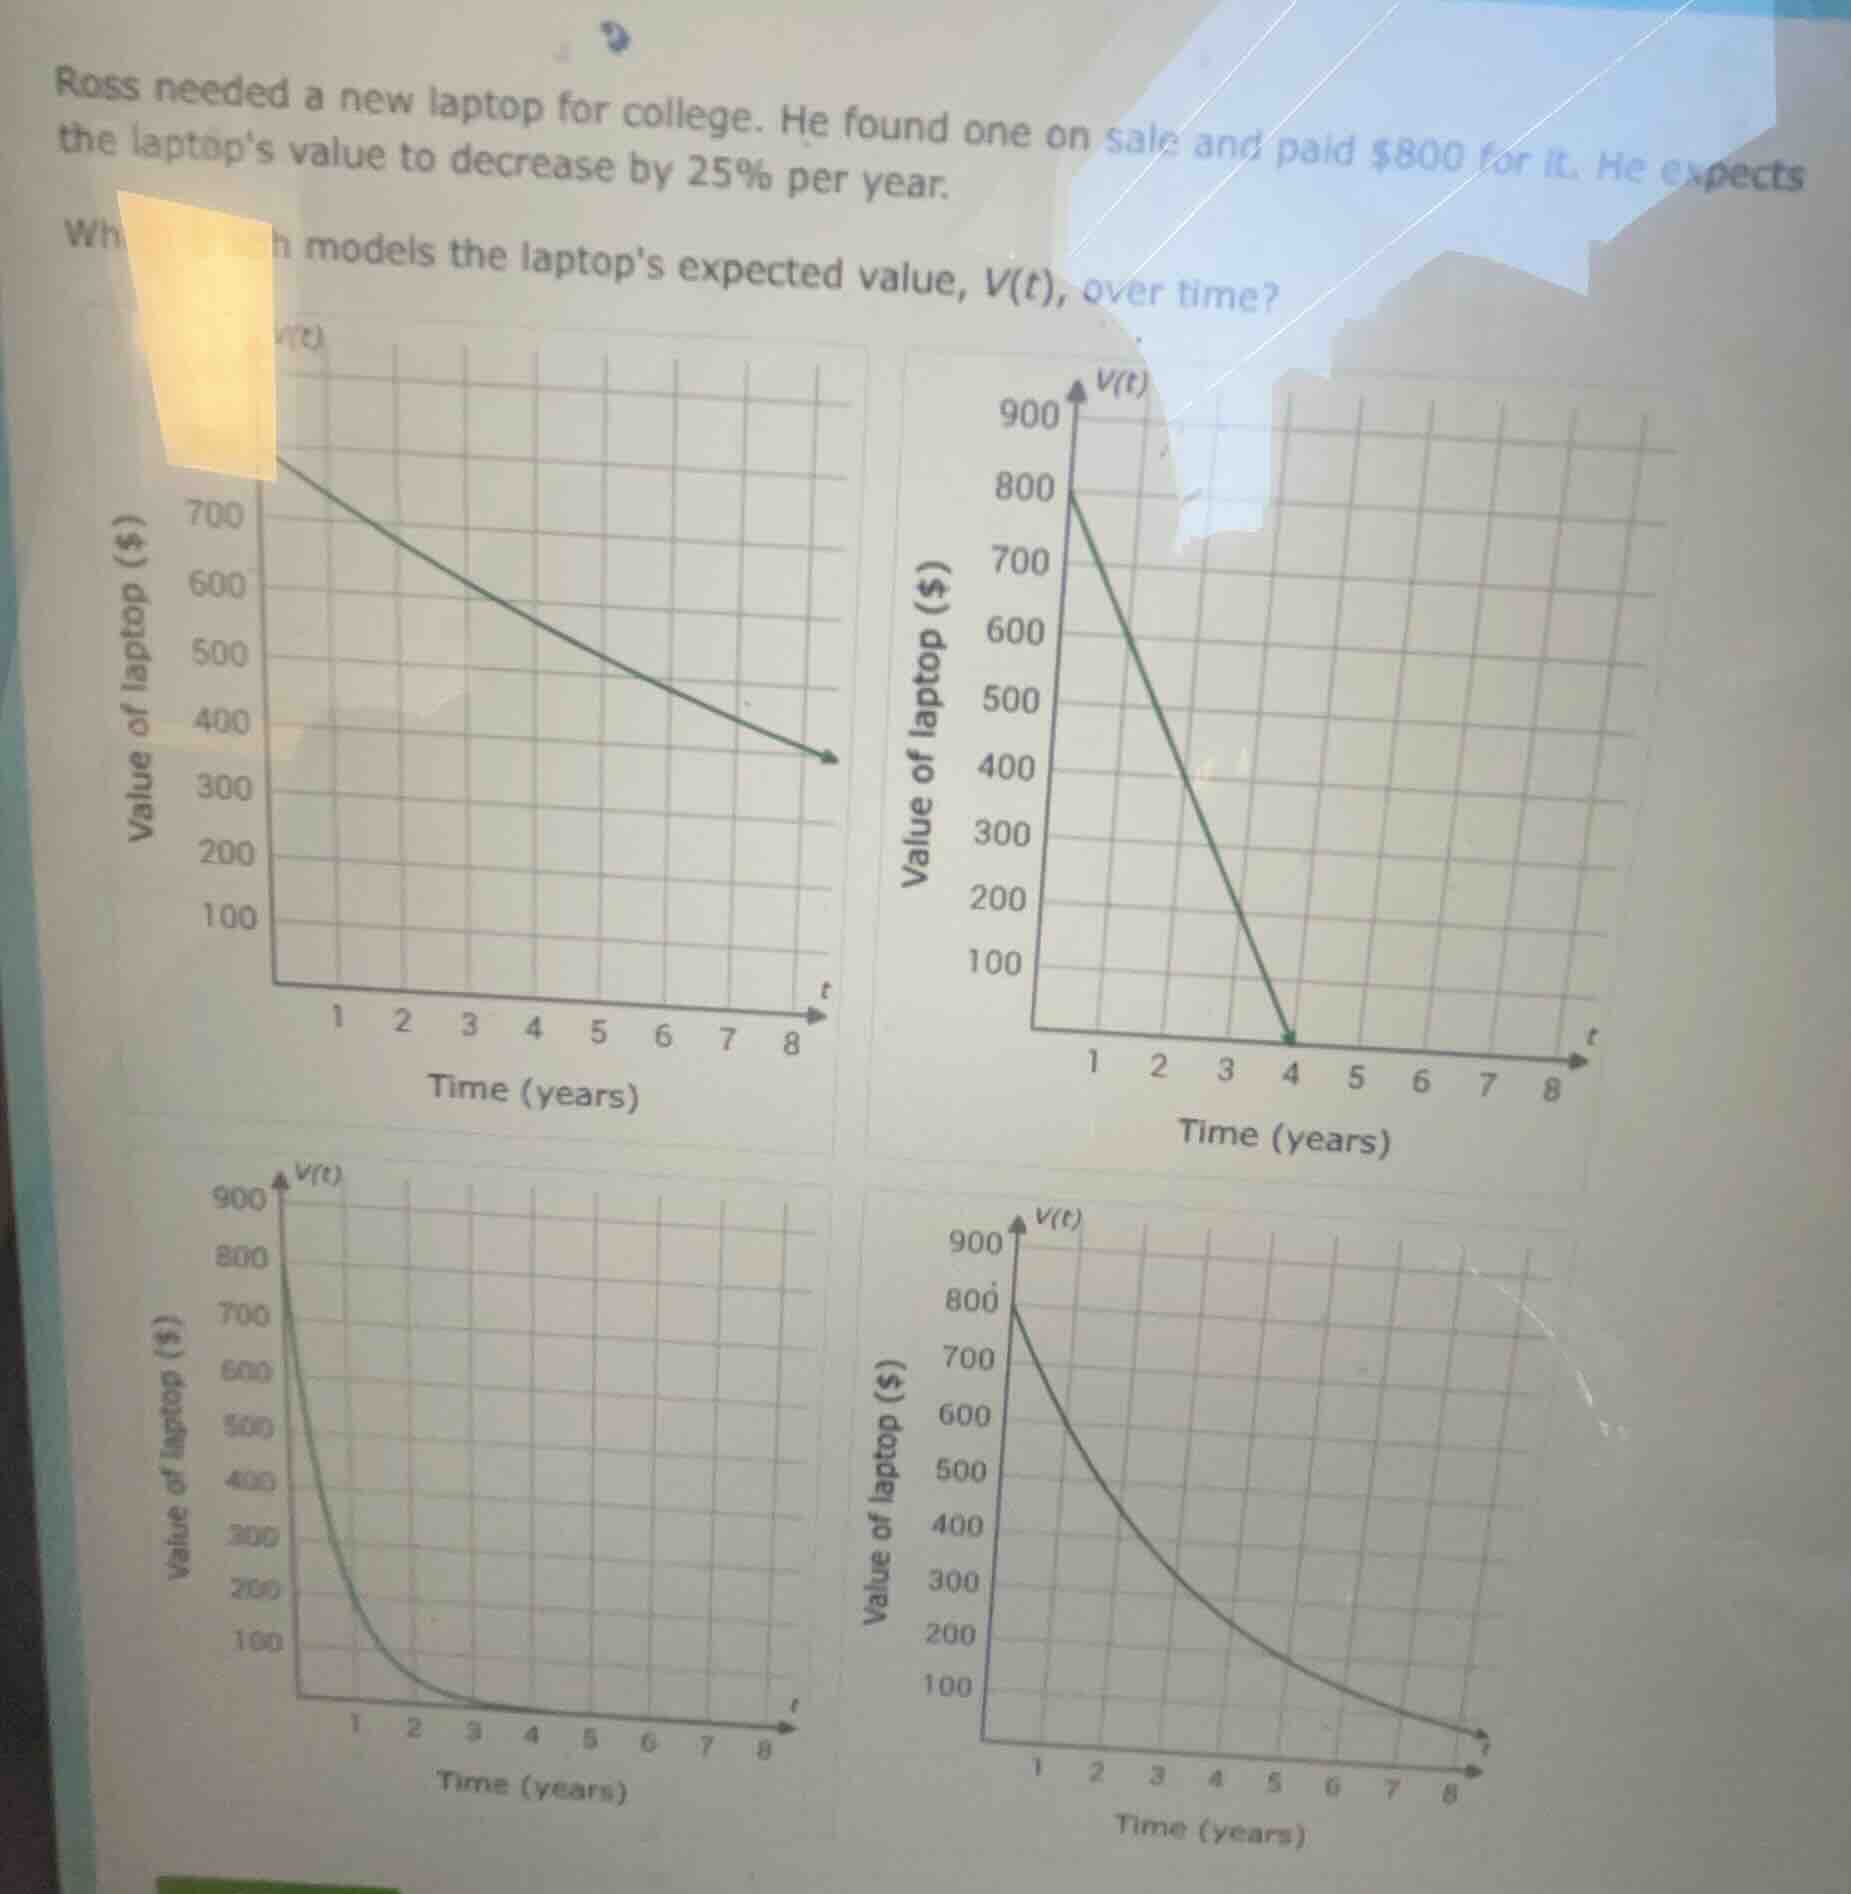
ross needed a new laptop for college. he found one on sale and paid $800 for it. he expects the laptops value to decrease by 25% per year. which function models the laptops expected value, v(t), over time?
Step1: Identify the type of decay
The laptop's value decreases by a percentage (25%) per year, so this is exponential decay. The formula for exponential decay is \( V(t) = V_0(1 - r)^t \), where \( V_0 \) is the initial value, \( r \) is the rate of decay, and \( t \) is time in years.
Step2: Determine the values of \( V_0 \) and \( r \)
The initial value \( V_0 = 800 \) dollars. The decay rate \( r = 25\% = 0.25 \), so \( 1 - r = 1 - 0.25 = 0.75 \). Thus, the formula is \( V(t) = 800(0.75)^t \).
Step3: Analyze the graph shape
Exponential decay graphs are curves that decrease rapidly at first and then slow down, approaching zero but never reaching it (for positive \( t \)). Let's check the options:
- The first graph is linear (straight line), which would be for linear decay (constant amount decrease, not percentage), so not this.
- The second graph is a straight line decreasing to zero at \( t = 4 \), which is not exponential (exponential doesn't hit zero in finite time).
- The third graph decreases too rapidly (maybe a different decay factor or not exponential).
- The fourth graph is a curve that starts at 800, decreases by a percentage each year (since \( 0.75^t \) is exponential decay), matching the exponential decay shape.

Snap & solve any problem in the app
Get step-by-step solutions on Sovi AI
Photo-based solutions with guided steps
Explore more problems and detailed explanations
The graph that models the laptop's value is the fourth one (the bottom - right graph) with the equation \( V(t)=800(0.75)^t \), which is an exponential decay curve starting at (0, 800) and decreasing towards zero as \( t \) increases, with the characteristic shape of exponential decay (curved, decreasing more slowly over time).