QUESTION IMAGE
Question
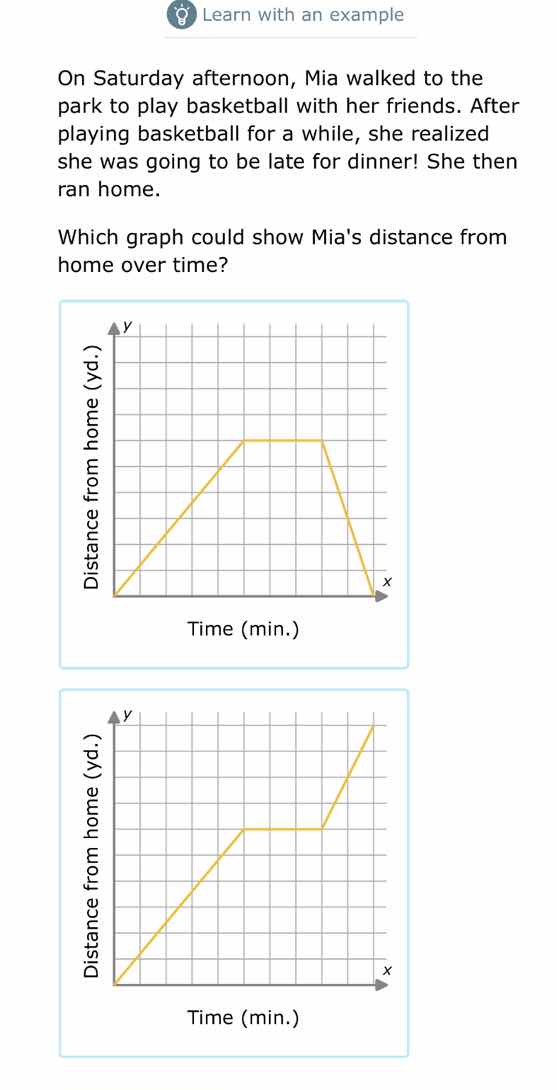
on saturday afternoon, mia walked to the park to play basketball with her friends. after playing basketball for a while, she realized she was going to be late for dinner! she then ran home. which graph could show mias distance from home over time?
Step1: Analyze Mia's movement
Mia walks to the park (distance from home increases), plays basketball (distance stays constant), then runs home (distance decreases to 0).
Step2: Evaluate first graph
First graph: Increases (walking to park), constant (playing), then decreases to 0 (running home) – matches.
Step3: Evaluate second graph
Second graph: Increases, constant, then increases – doesn't match (should decrease to home).

Snap & solve any problem in the app
Get step-by-step solutions on Sovi AI
Photo-based solutions with guided steps
Explore more problems and detailed explanations
The first graph (the one with the yellow line that rises, stays flat, then falls to the x - axis)