QUESTION IMAGE
Question
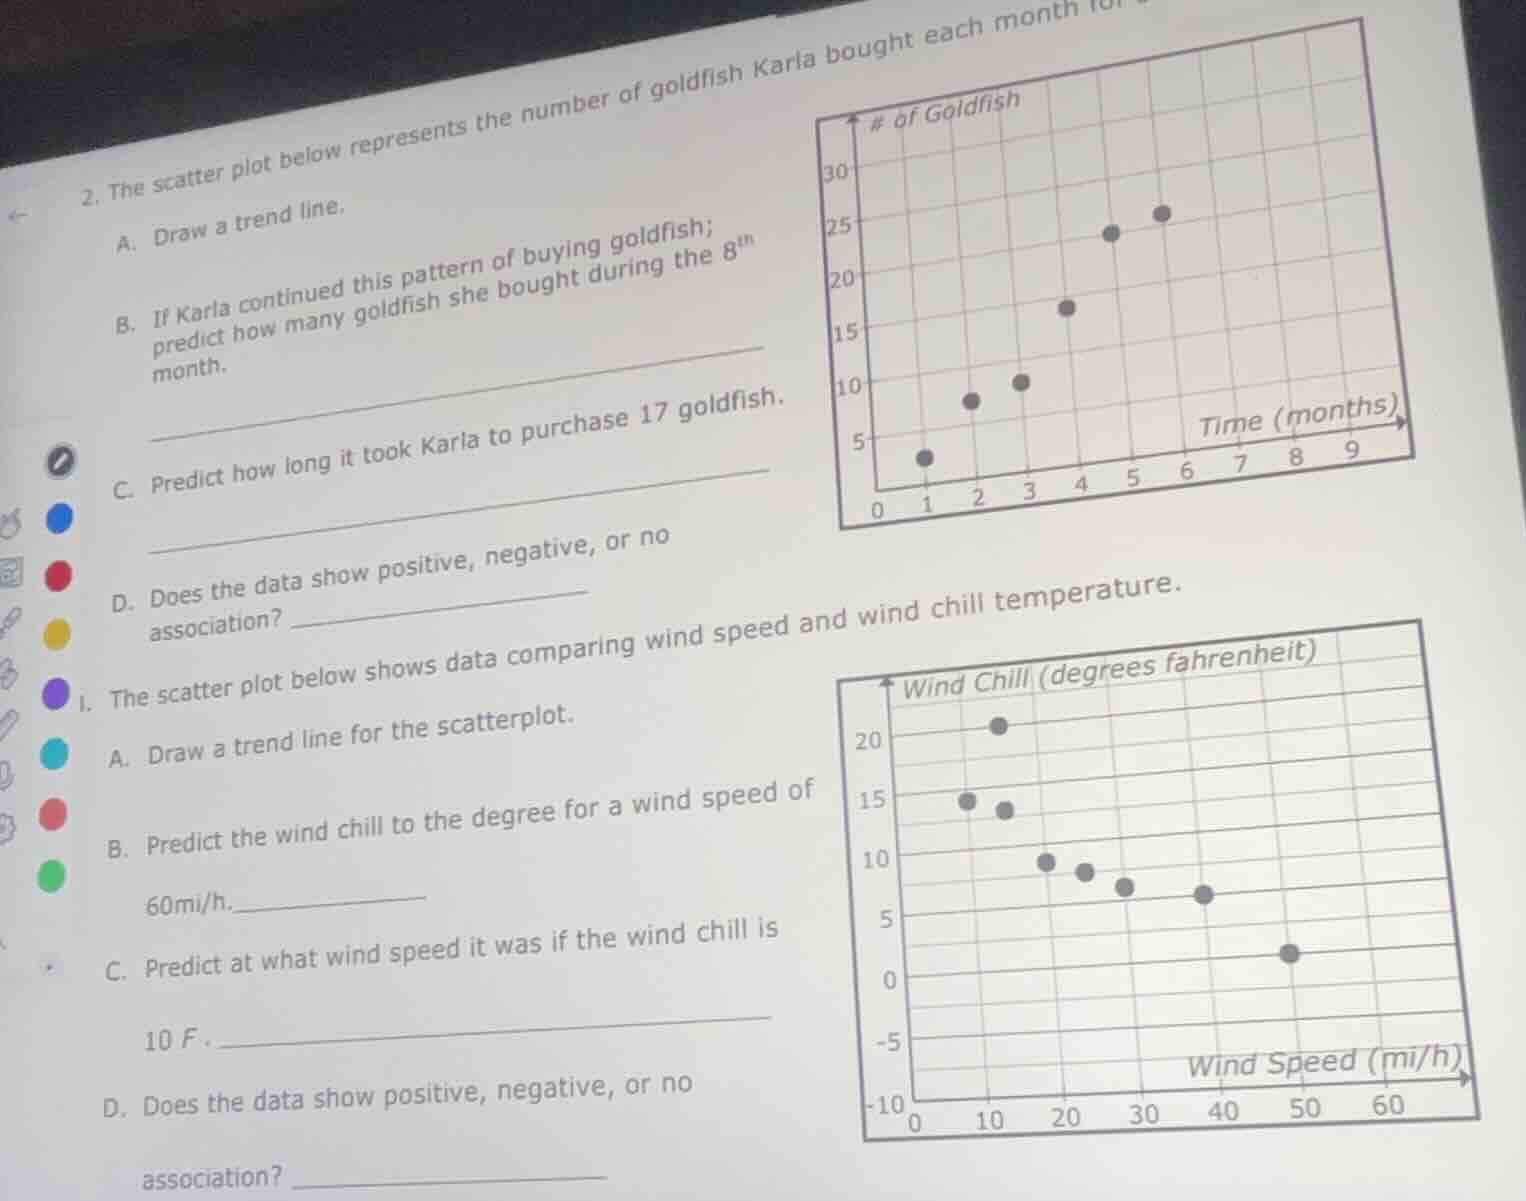
- the scatter plot below represents the number of goldfish karla bought each month fora. draw a trend line.b. if karla continued this pattern of buying goldfish; predict how many goldfish she bought during the 8th month.c. predict how long it took karla to purchase 17 goldfish.d. does the data show positive, negative, or no association?i. the scatter plot below shows data comparing wind speed and wind chill temperature.a. draw a trend line for the scatterplot.b. predict the wind chill to the degree for a wind speed of 60mi/h.c. predict at what wind speed it was if the wind chill is 10 f.d. does the data show positive, negative, or no association?
First Scatter Plot (Goldfish & Time)
Step1: Identify trend line slope
First, pick two points on the trend: (1,3) and (6,25). Calculate slope:
$m=\frac{25-3}{6-1}=\frac{22}{5}=4.4$
Step2: Find trend line equation
Use point-slope form with (1,3):
$y-3=4.4(x-1)$
$y=4.4x-1.4$
Step3: Predict 8th month goldfish
Substitute $x=8$ into the equation:
$y=4.4(8)-1.4=35.2-1.4=33.8\approx34$
Step4: Predict time for 17 goldfish
Substitute $y=17$ and solve for $x$:
$17=4.4x-1.4$
$4.4x=18.4$
$x=\frac{18.4}{4.4}\approx4.2$ (≈4 months)
Step5: Identify association type
As time increases, goldfish count increases: positive association.
Step1: Identify trend line slope
Pick two points on the trend: (10,20) and (50,2). Calculate slope:
$m=\frac{2-20}{50-10}=\frac{-18}{40}=-0.45$
Step2: Find trend line equation
Use point-slope form with (10,20):
$y-20=-0.45(x-10)$
$y=-0.45x+24.5$
Step3: Predict wind chill at 60mi/h
Substitute $x=60$ into the equation:
$y=-0.45(60)+24.5=-27+24.5=-2.5\approx-3^\circ F$
Step4: Predict speed for 10°F
Substitute $y=10$ and solve for $x$:
$10=-0.45x+24.5$
$0.45x=14.5$
$x=\frac{14.5}{0.45}\approx32.2$ (≈32 mi/h)
Step5: Identify association type
As wind speed increases, wind chill decreases: negative association.

Snap & solve any problem in the app
Get step-by-step solutions on Sovi AI
Photo-based solutions with guided steps
Explore more problems and detailed explanations
A. (Trend line: Draw a line through the middle of the plotted points, roughly passing through (1,3) and (6,25))
B. 34
C. 4 months
D. Positive association
---