QUESTION IMAGE
Question
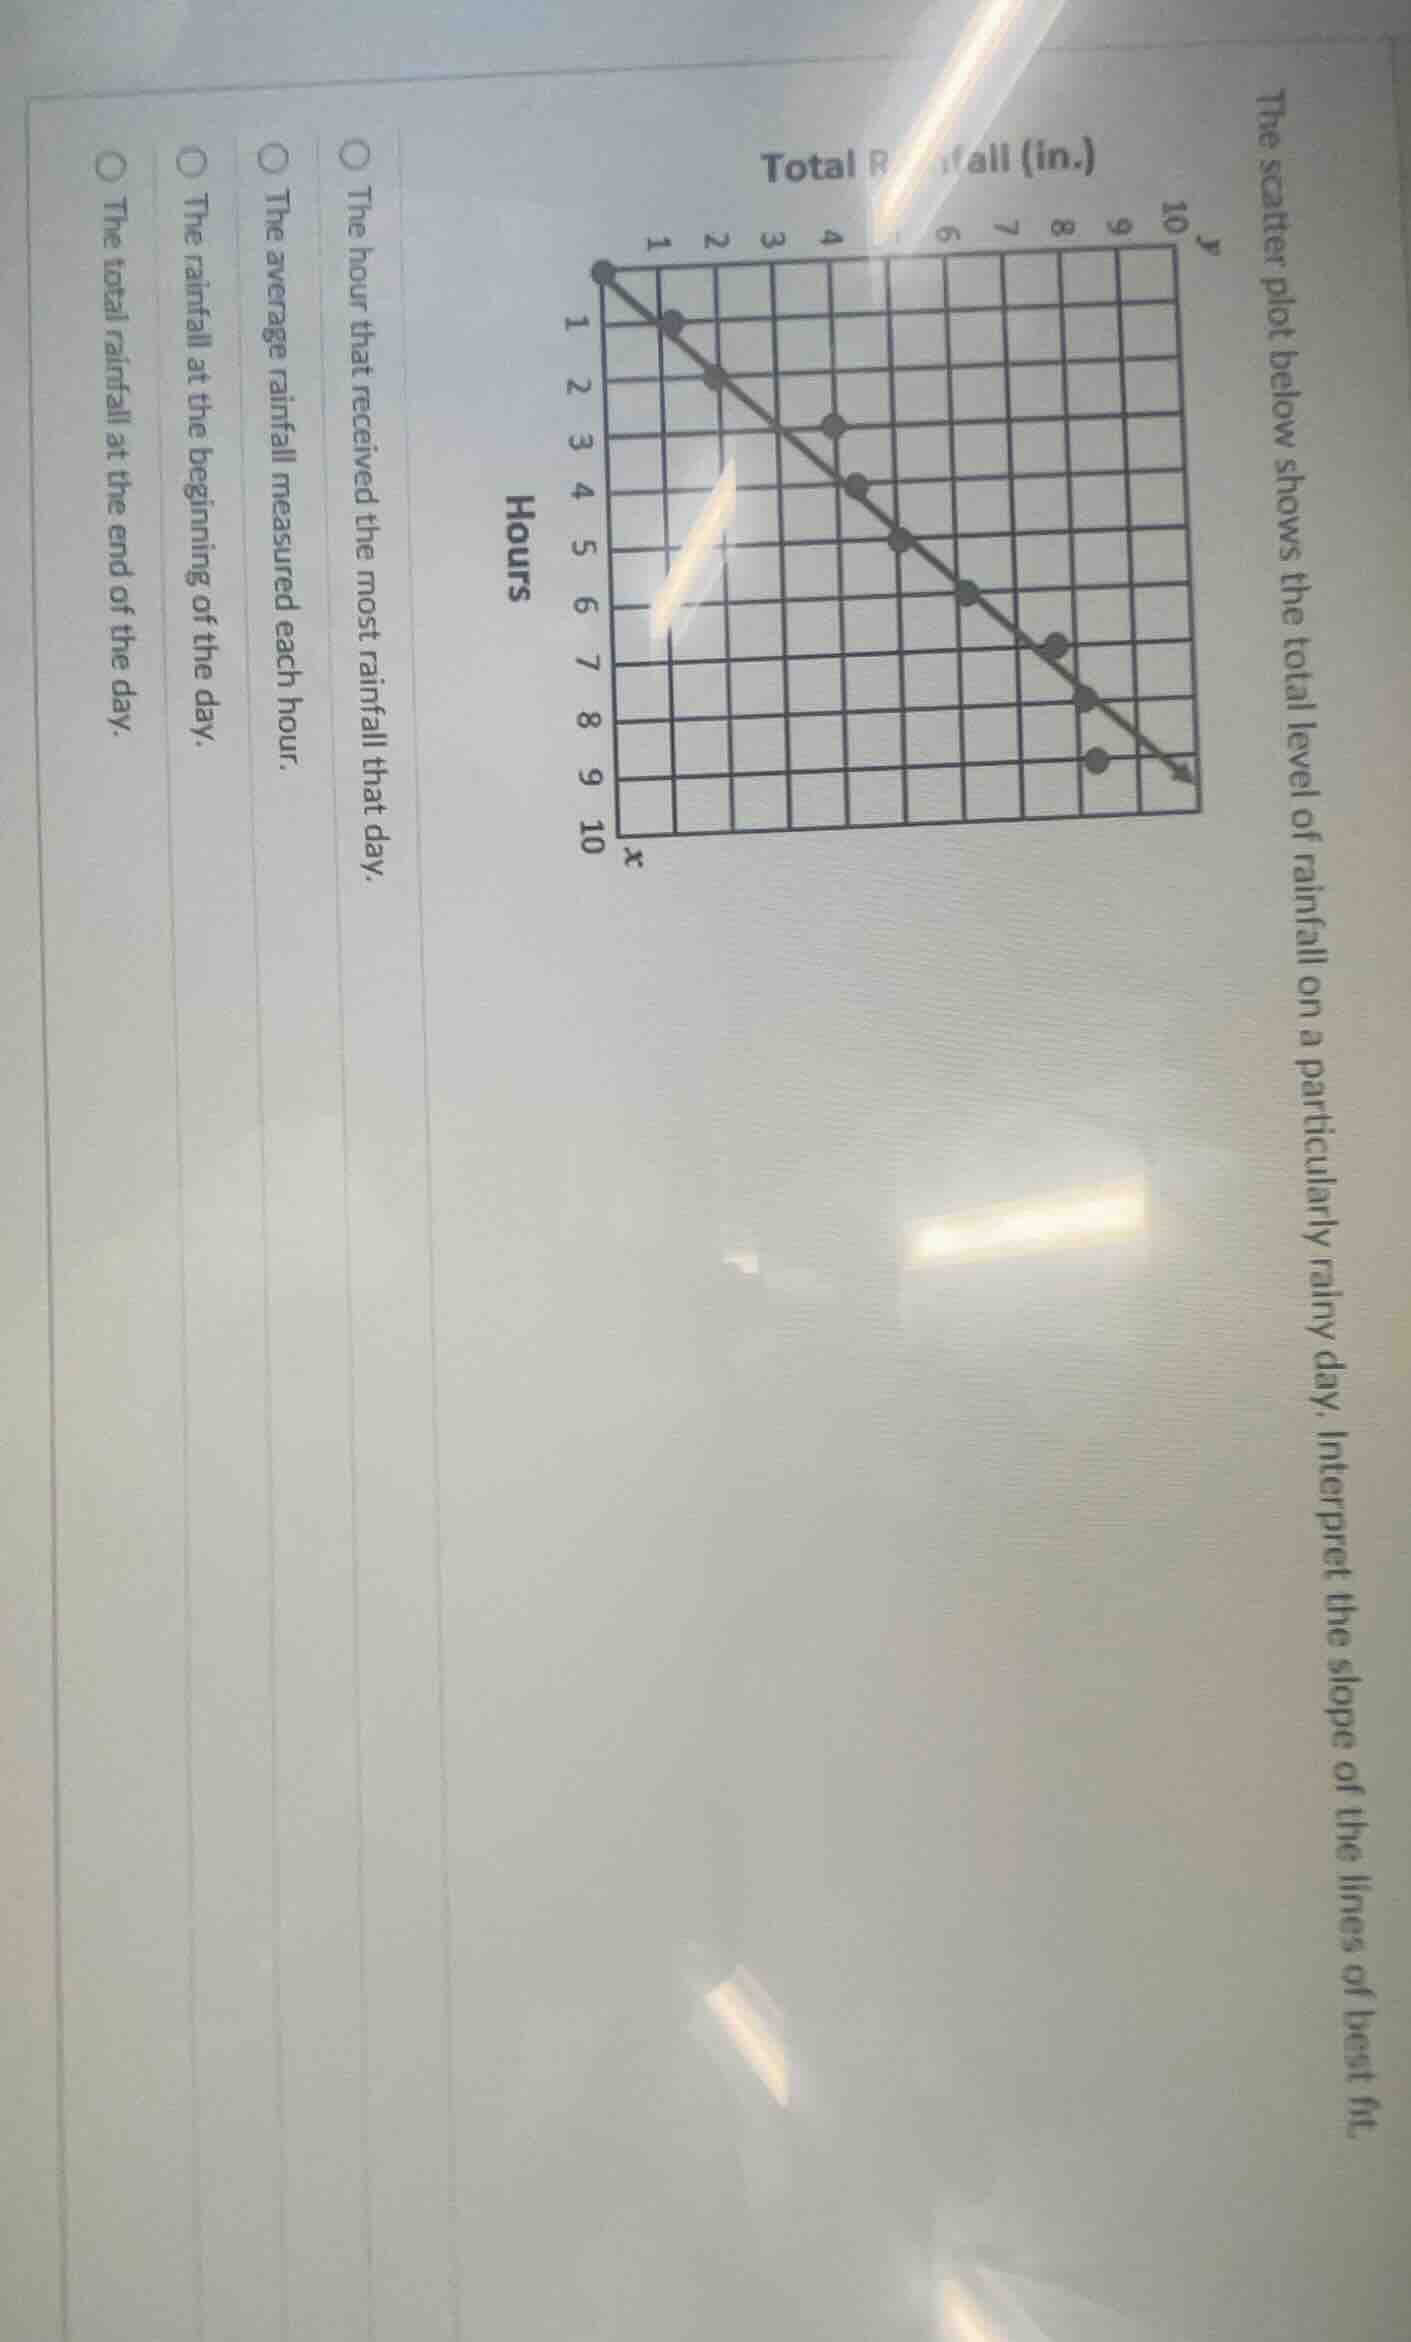
the scatter plot below shows the total level of rainfall on a particularly rainy day. interpret the slope of the lines of best fit.total rainfall (in.)hours○ the hour that received the most rainfall that day.○ the average rainfall measured each hour.○ the rainfall at the beginning of the day.○ the total rainfall at the end of the day.
The slope of a line of best fit in this scatter plot represents the average rate of change of total rainfall with respect to time (hours). Each unit increase in x (hours) corresponds to a 1-unit increase in y (total rainfall), meaning this is the average amount of rain added each hour.

Snap & solve any problem in the app
Get step-by-step solutions on Sovi AI
Photo-based solutions with guided steps
Explore more problems and detailed explanations
○ The average rainfall measured each hour.