QUESTION IMAGE
Question
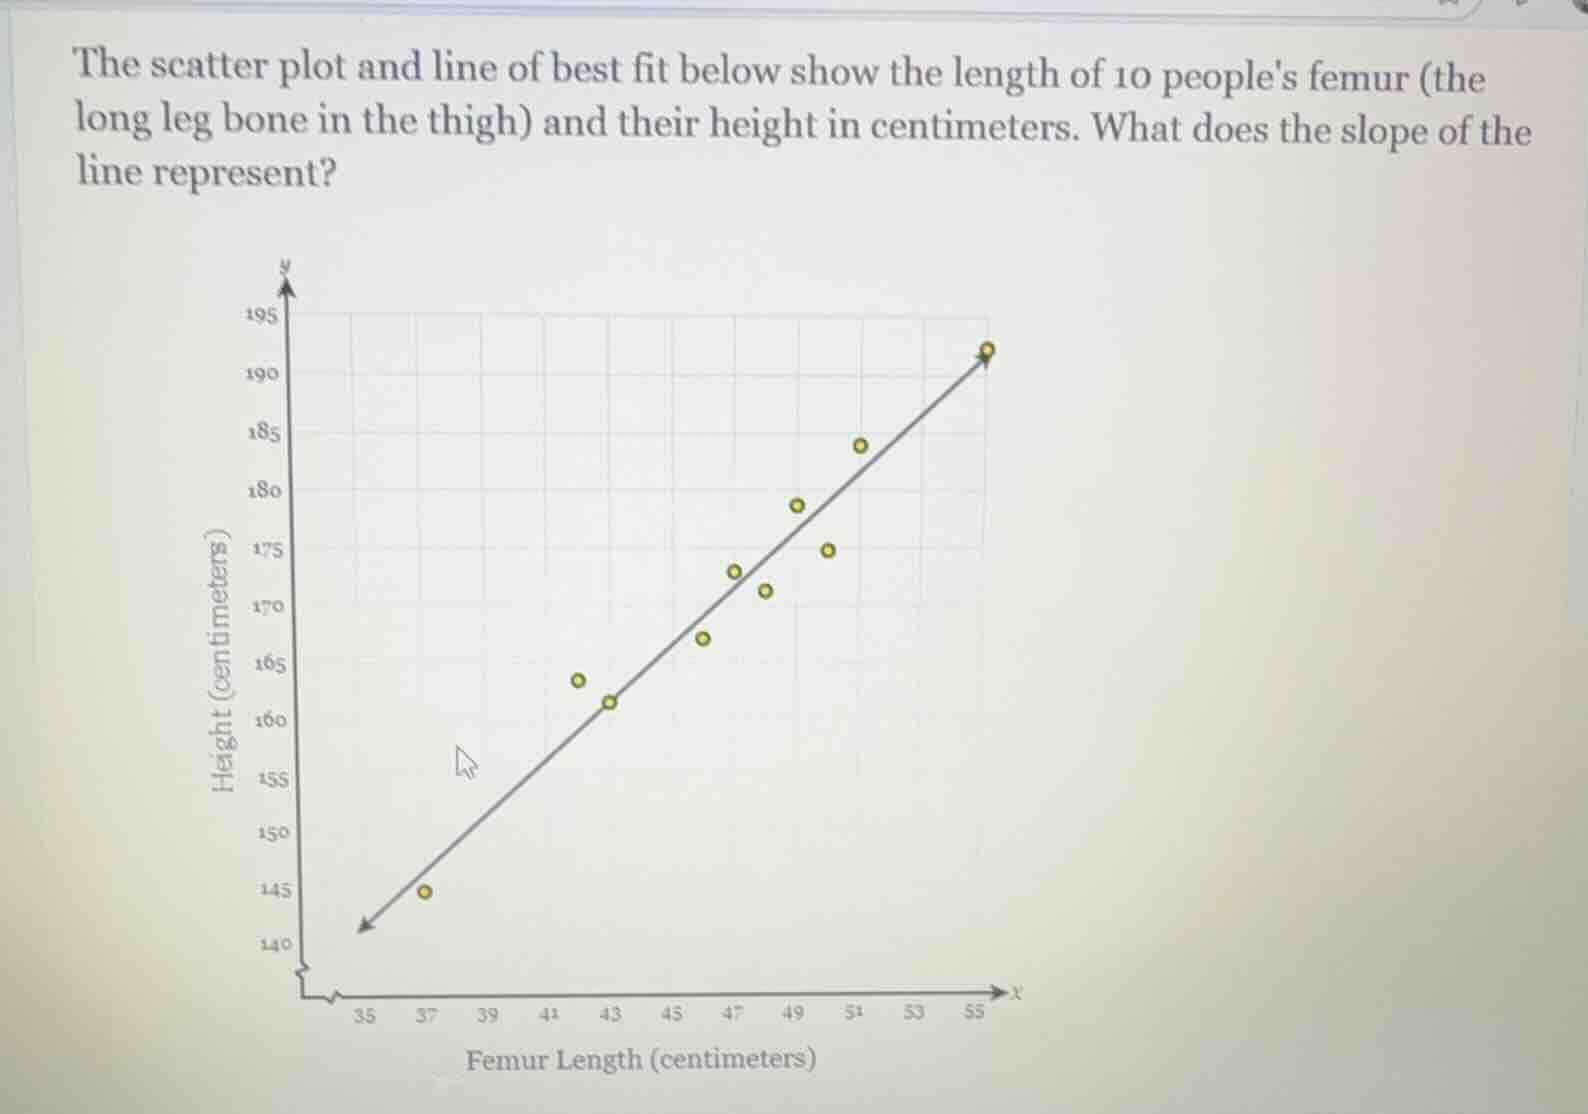
the scatter plot and line of best fit below show the length of 10 peoples femur (the long leg bone in the thigh) and their height in centimeters. what does the slope of the line represent?
The x-axis represents femur length (independent variable) and the y-axis represents height (dependent variable). The slope of a line of best fit is the change in the dependent variable per unit change in the independent variable. Here, that means the increase in height corresponding to each 1-centimeter increase in femur length.

Snap & solve any problem in the app
Get step-by-step solutions on Sovi AI
Photo-based solutions with guided steps
Explore more problems and detailed explanations
The slope represents the approximate increase in a person's height (in centimeters) for each 1-centimeter increase in the length of their femur.