QUESTION IMAGE
Question
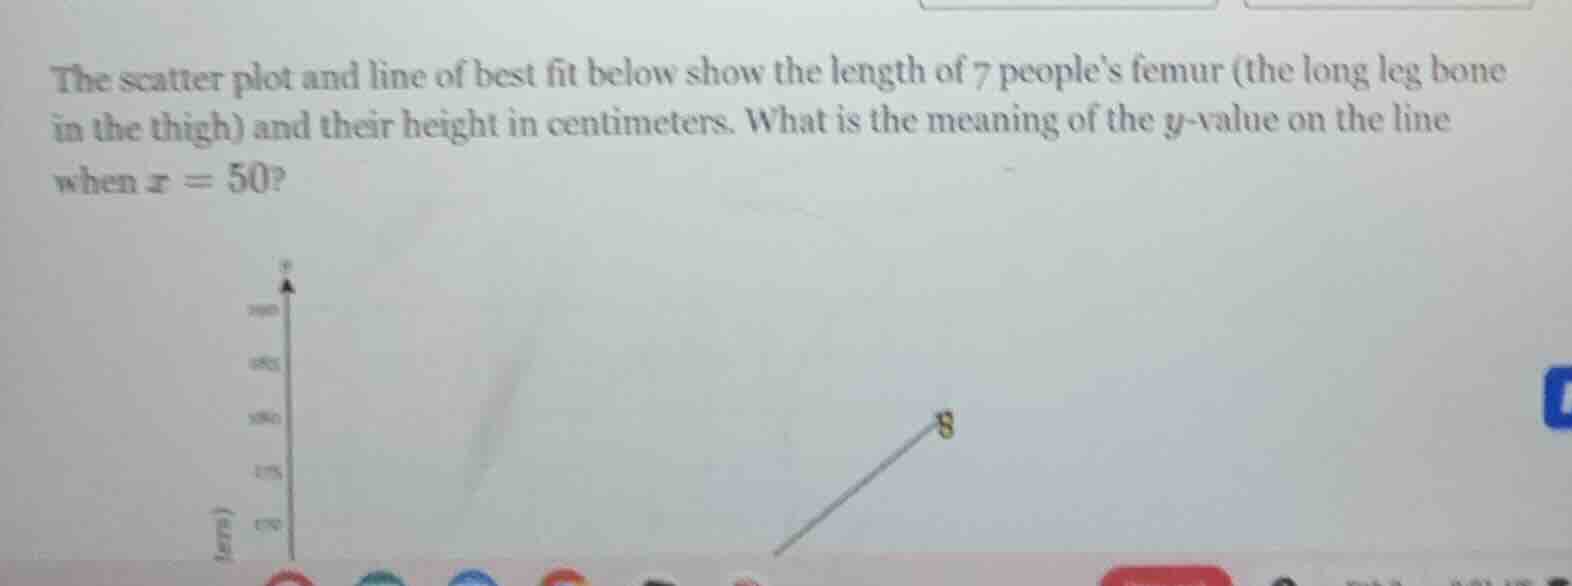
the scatter plot and line of best fit below show the length of 7 peoples femur (the long leg bone in the thigh) and their height in centimeters. what is the meaning of the $y$-value on the line when $x = 50$?
The line of best fit is a predictive model for the relationship between femur length (x-variable) and height (y-variable). When $x=50$, the corresponding y-value represents the predicted average height for a person with a femur length of 50 centimeters, based on the trend observed in the 7 people's data.

Snap & solve any problem in the app
Get step-by-step solutions on Sovi AI
Photo-based solutions with guided steps
Explore more problems and detailed explanations
The y-value when $x=50$ is the predicted average height (in centimeters) of a person whose femur length is 50 centimeters, according to the trend shown by the line of best fit.