QUESTION IMAGE
Question
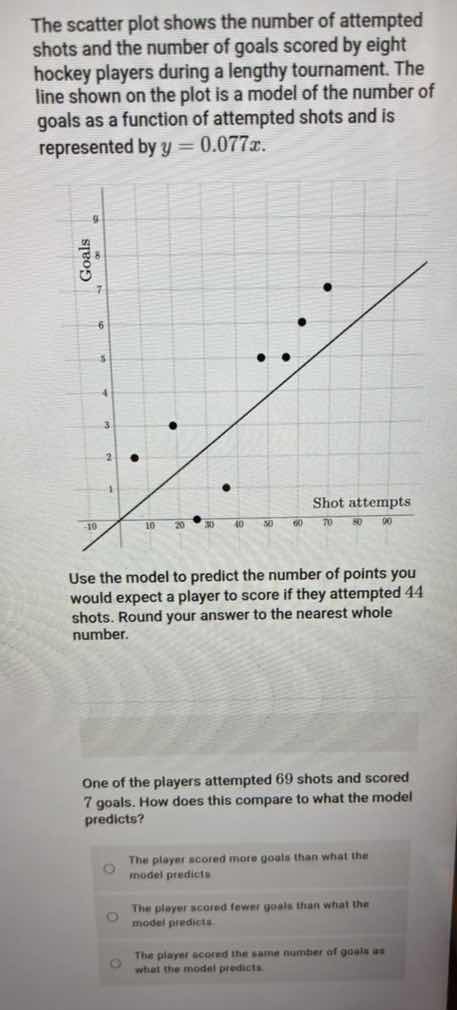
the scatter plot shows the number of attempted shots and the number of goals scored by eight hockey players during a lengthy tournament. the line shown on the plot is a model of the number of goals as a function of attempted shots and is represented by $y = 0.077x$.
use the model to predict the number of points you would expect a player to score if they attempted 44 shots. round your answer to the nearest whole number.
one of the players attempted 69 shots and scored 7 goals. how does this compare to what the model predicts?
$\bigcirc$ the player scored more goals than what the model predicts
$\bigcirc$ the player scored fewer goals than what the model predicts.
$\bigcirc$ the player scored the same number of goals as what the model predicts.
Step1: Substitute x=44 into model
$y = 0.077 \times 44$
Step2: Calculate the predicted goals
$y = 3.388$
Step3: Round to nearest whole number
$y \approx 3$
Step4: Substitute x=69 into model
$y = 0.077 \times 69$
Step5: Calculate model's prediction
$y = 5.313$
Step6: Compare to actual 7 goals
$7 > 5.313$

Snap & solve any problem in the app
Get step-by-step solutions on Sovi AI
Photo-based solutions with guided steps
Explore more problems and detailed explanations
- Predicted goals for 44 attempts: 3
- A. The player scored more goals than what the model predicts.