QUESTION IMAGE
Question
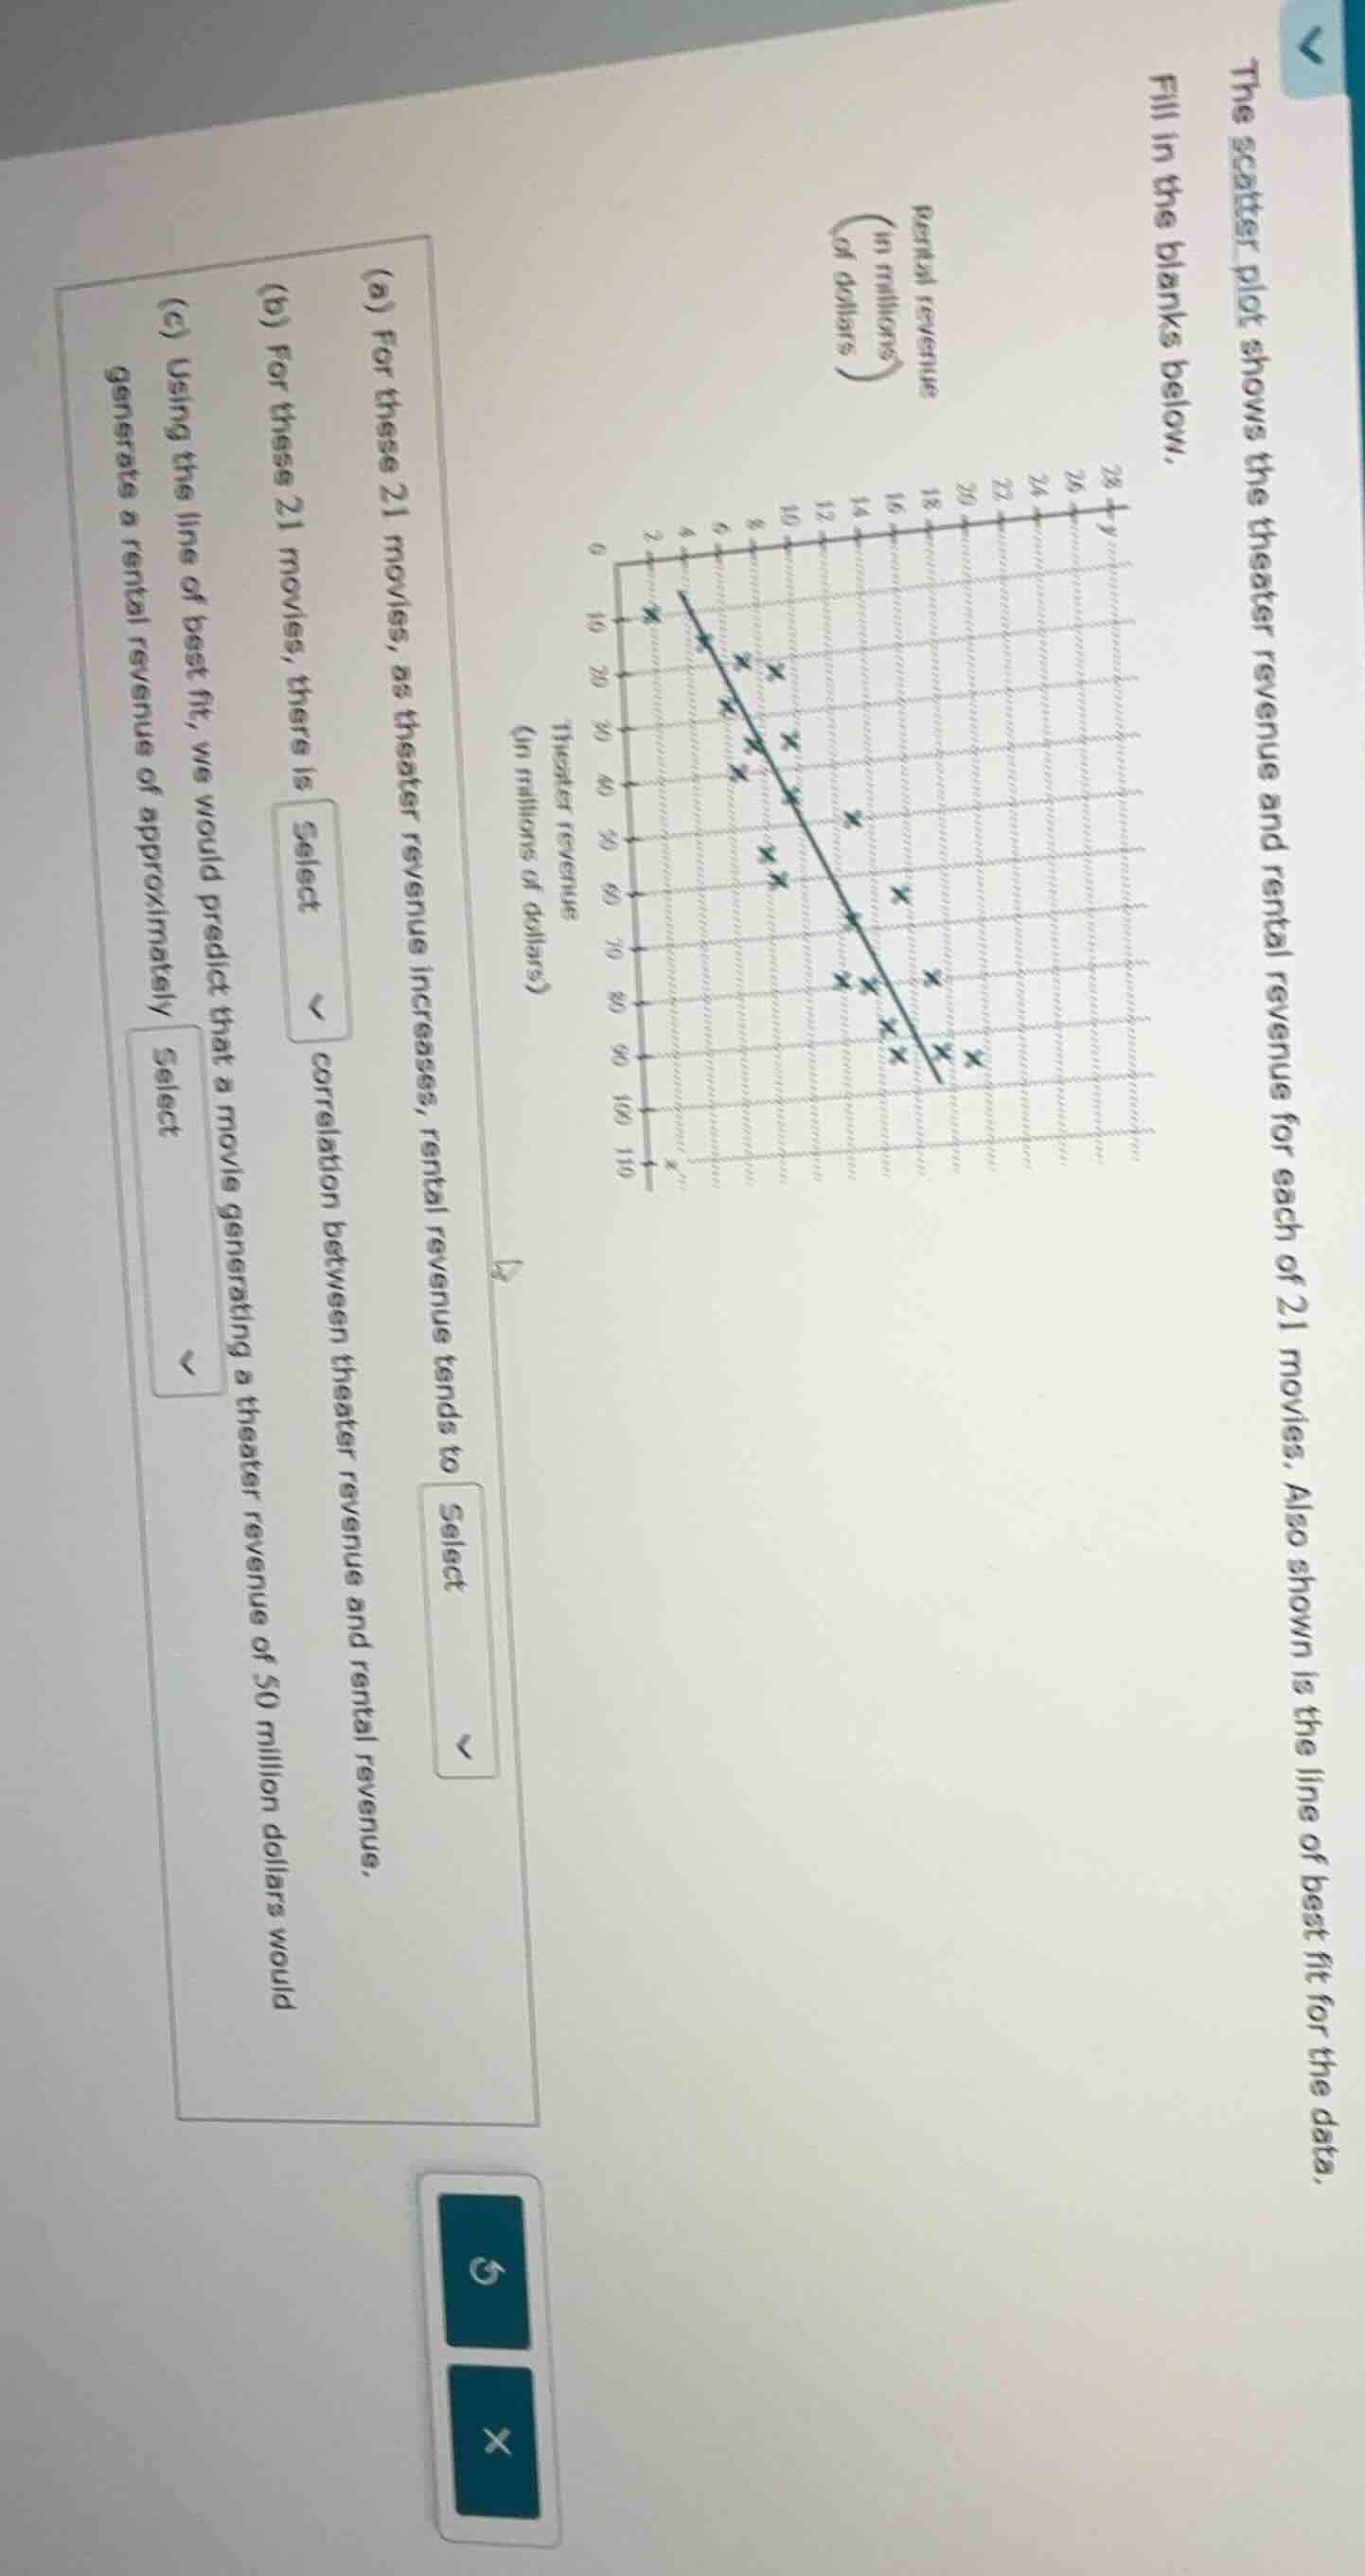
the scatter plot shows the theater revenue and rental revenue for each of 21 movies. also shown is the line of best fit for the data. fill in the blanks below.
(a) for these 21 movies, as theater revenue increases, rental revenue tends to select
(b) for these 21 movies, there is select correlation between theater revenue and rental revenue.
(c) using the line of best fit, we would predict that a movie generating a theater revenue of 50 million dollars would generate a rental revenue of approximately select
Step1: Analyze trend in scatter plot
Observe that as x (theater revenue) increases, y (rental revenue) moves upward along the line of best fit.
Step2: Identify correlation type
The upward trend means higher theater revenue pairs with higher rental revenue, so this is a positive correlation.
Step3: Predict rental revenue at $x=50$
Locate $x=50$ on the x-axis, move up to the line of best fit, then left to the y-axis. The corresponding y-value is 8.

Snap & solve any problem in the app
Get step-by-step solutions on Sovi AI
Photo-based solutions with guided steps
Explore more problems and detailed explanations
(a) increase
(b) positive
(c) 8 million dollars