QUESTION IMAGE
Question
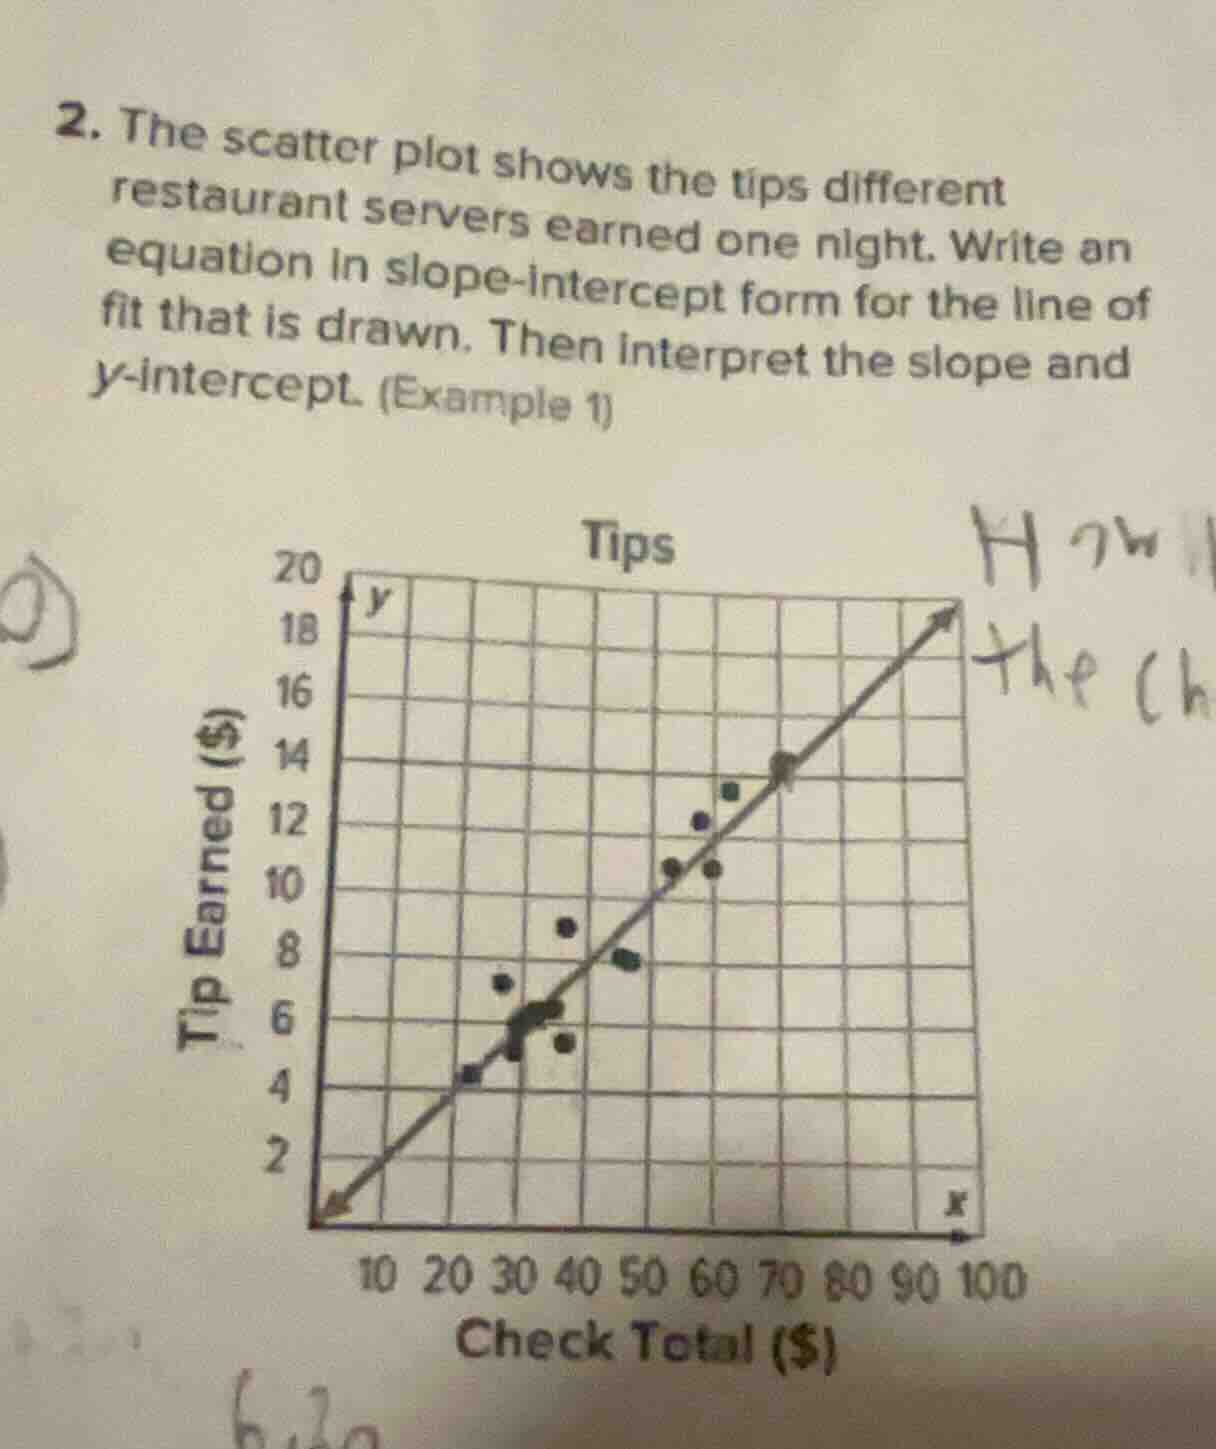
- the scatter plot shows the tips different restaurant servers earned one night. write an equation in slope-intercept form for the line of fit that is drawn. then interpret the slope and y-intercept. (example 1) scatter plot with x-axis: check total ($) from 10 to 100, y-axis: tip earned ($) from 2 to 20, line of fit drawn
Step1: Identify two points on line
Choose points $(20, 4)$ and $(70, 14)$
Step2: Calculate slope $m$
Slope formula: $m=\frac{y_2-y_1}{x_2-x_1}$
$m=\frac{14-4}{70-20}=\frac{10}{50}=0.2$
Step3: Find y-intercept $b$
Use $y=mx+b$ with $(20,4)$:
$4=0.2(20)+b$
$4=4+b$
$b=0$
Step4: Write slope-intercept equation
Substitute $m=0.2, b=0$ into $y=mx+b$
$y=0.2x$
Step5: Interpret slope and intercept
Slope: For each $1 increase in check total, tip increases by $0.20.
Y-intercept: When check total is $0, tip is $0.

Snap & solve any problem in the app
Get step-by-step solutions on Sovi AI
Photo-based solutions with guided steps
Explore more problems and detailed explanations
Equation: $y = 0.2x$
Slope interpretation: Each $1 increase in the total check corresponds to a $0.20 increase in the tip.
Y-intercept interpretation: When the total check is $0, the expected tip is $0.