QUESTION IMAGE
Question
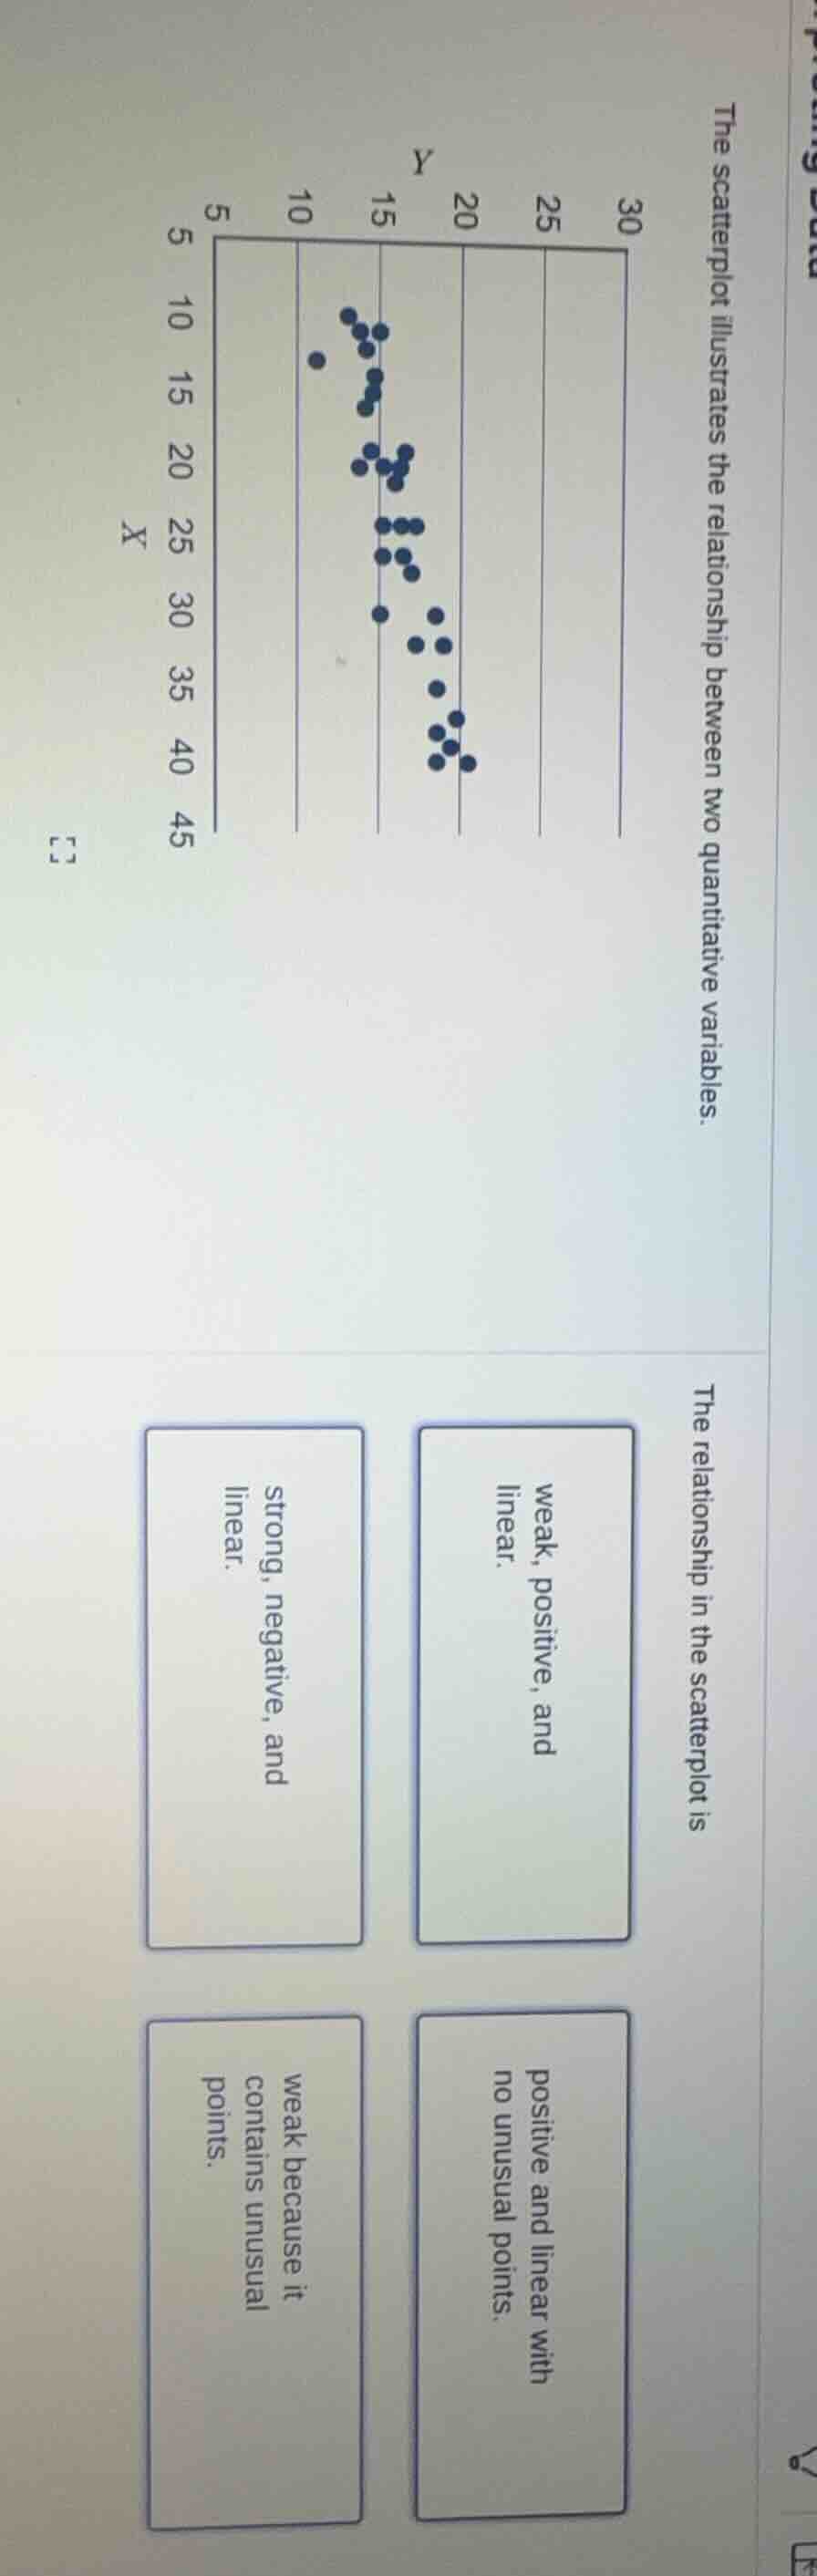
the scatterplot illustrates the relationship between two quantitative variables.
the relationship in the scatterplot is
weak, positive, and linear.
strong, negative, and linear.
positive and linear with no unusual points.
weak because it contains unusual points.
Brief Explanations
Al observar el diagrama de dispersión, se nota que a medida que el valor de X aumenta, el valor de Y disminuye de forma consistente, lo que indica una relación negativa. Además, los puntos se agrupan de manera cercana a una línea imaginaria descendente, por lo que la relación es fuerte y lineal.

Snap & solve any problem in the app
Get step-by-step solutions on Sovi AI
Photo-based solutions with guided steps
Explore more problems and detailed explanations
strong, negative, and linear.