QUESTION IMAGE
Question
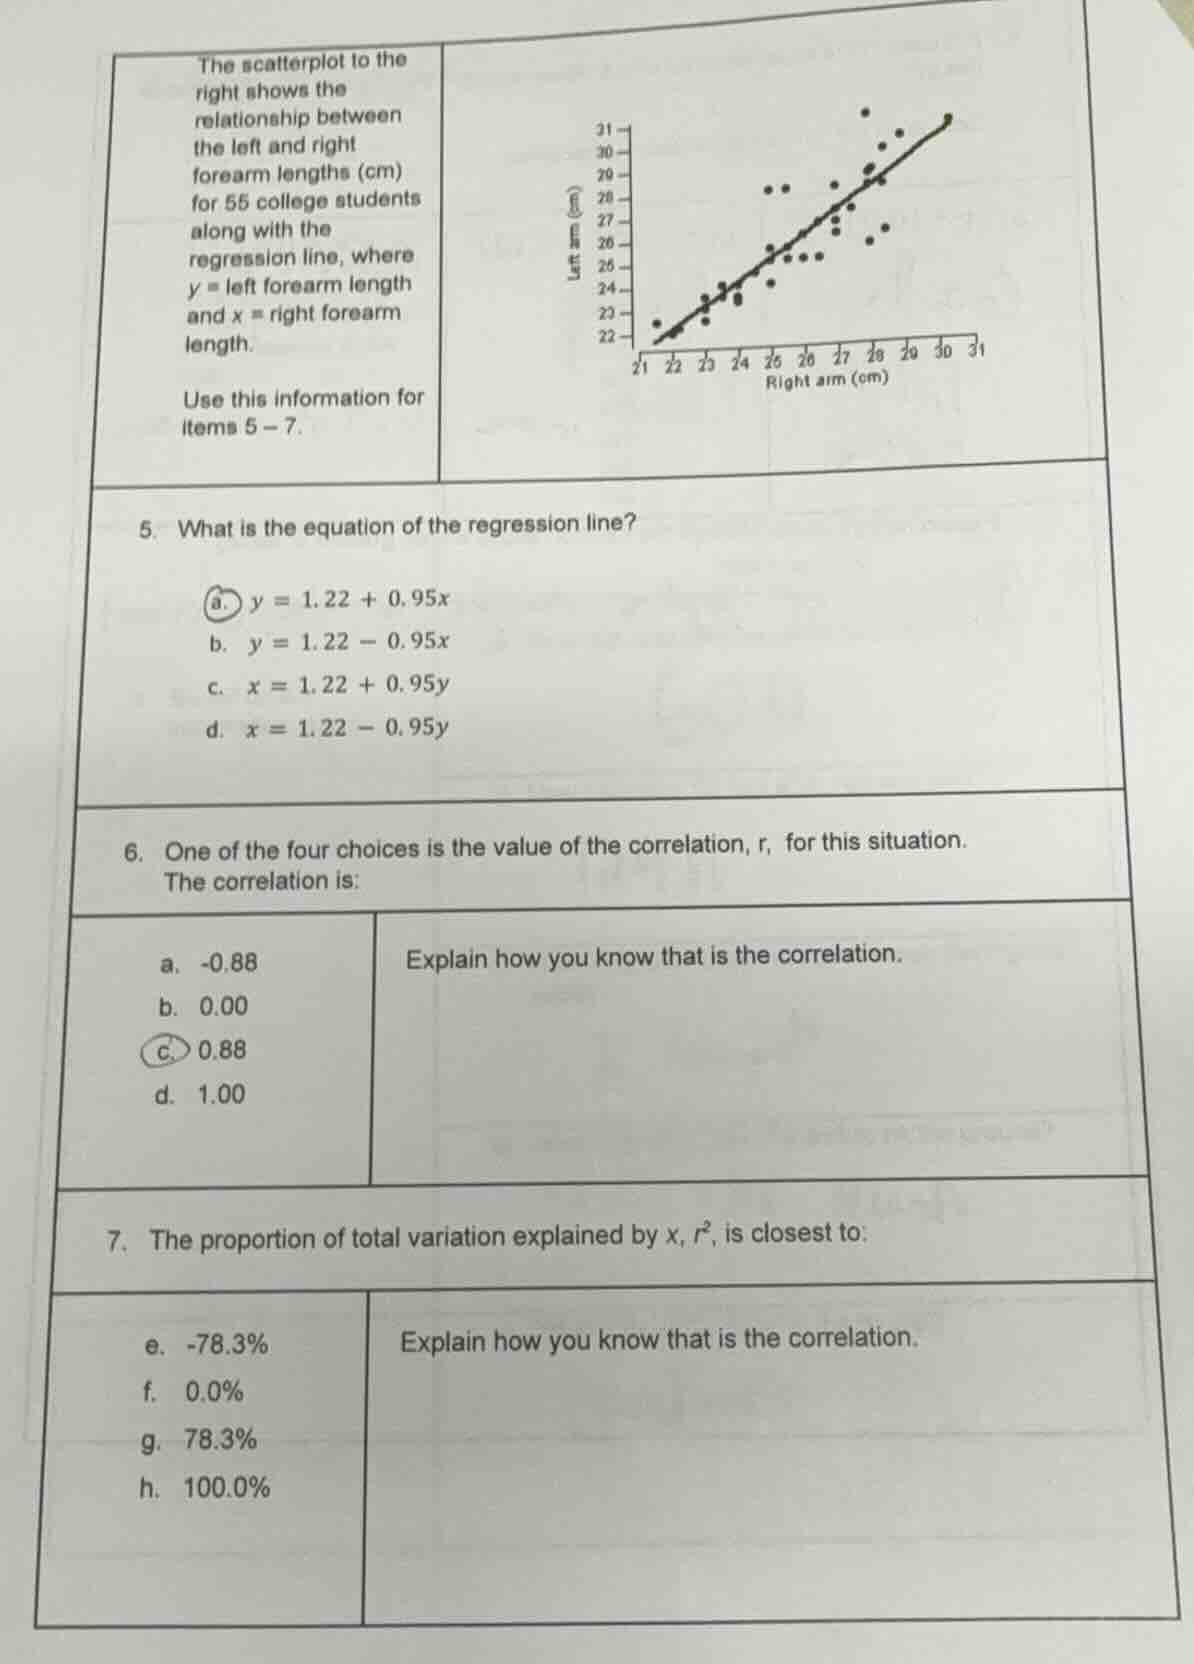
the scatterplot to the right shows the relationship between the left and right forearm lengths (cm) for 55 college students along with the regression line, where y = left forearm length and x = right forearm length. use this information for items 5 - 7. 5. what is the equation of the regression line? a. $y = 1.22 + 0.95x$ b. $y = 1.22 - 0.95x$ c. $x = 1.22 + 0.95y$ d. $x = 1.22 - 0.95y$ 6. one of the four choices is the value of the correlation, r, for this situation. the correlation is: a. -0.88 b. 0.00 c. 0.88 d. 1.00 explain how you know that is the correlation. 7. the proportion of total variation explained by x, $r^2$, is closest to: e. -78.3% f. 0.0% g. 78.3% h. 100.0% explain how you know that is the correlation.
Question 5
Step1: Identify regression line form
The regression line is of the form \( y = a + bx \), where \( y \) is the response variable (left forearm length) and \( x \) is the predictor variable (right forearm length).
Step2: Analyze slope sign
From the scatterplot, as \( x \) (right forearm length) increases, \( y \) (left forearm length) also increases, so the slope \( b \) should be positive.
Step3: Evaluate options
- Option a: \( y = 1.22 + 0.95x \) has a positive slope (0.95) and is in the form \( y = a + bx \).
- Option b: Negative slope, incorrect (relationship is positive).
- Option c: Swaps \( x \) and \( y \), incorrect form (we predict \( y \) from \( x \)).
- Option d: Negative slope and swapped variables, incorrect.
The scatterplot shows a strong positive linear relationship (points cluster closely around an upward - sloping line). The correlation coefficient \( r \) measures the strength and direction of linear association. A positive \( r \) indicates a positive relationship, and a value close to 1 (but not exactly 1, since points aren't perfectly aligned) indicates a strong relationship.
- Option a: Negative, but the relationship is positive, so incorrect.
- Option b: 0.00 would mean no linear relationship, but there is a strong one, incorrect.
- Option c: 0.88 is positive and close to 1, consistent with a strong positive linear relationship.
- Option d: 1.00 would mean a perfect linear relationship, but the points aren't perfectly aligned, so incorrect.
Step1: Recall \( r^2 \) formula
The coefficient of determination \( r^2 \) is the square of the correlation coefficient \( r \), and it represents the proportion of total variation in \( y \) explained by \( x \).
Step2: Calculate \( r^2 \)
We know from question 6 that \( r = 0.88 \). Then \( r^2=(0.88)^2 = 0.7744\approx0.783 \) or 78.3%.
Step3: Evaluate options
- Option e: Negative, but \( r^2 \) can't be negative (it's a square), incorrect.
- Option f: 0.0% would mean no variation explained, but there is a strong relationship, incorrect.
- Option g: 78.3% matches our calculation of \( r^2\approx0.783 \).
- Option h: 100.0% would mean perfect prediction, but points aren't perfectly aligned, incorrect.

Snap & solve any problem in the app
Get step-by-step solutions on Sovi AI
Photo-based solutions with guided steps
Explore more problems and detailed explanations
a. \( y = 1.22 + 0.95x \)