QUESTION IMAGE
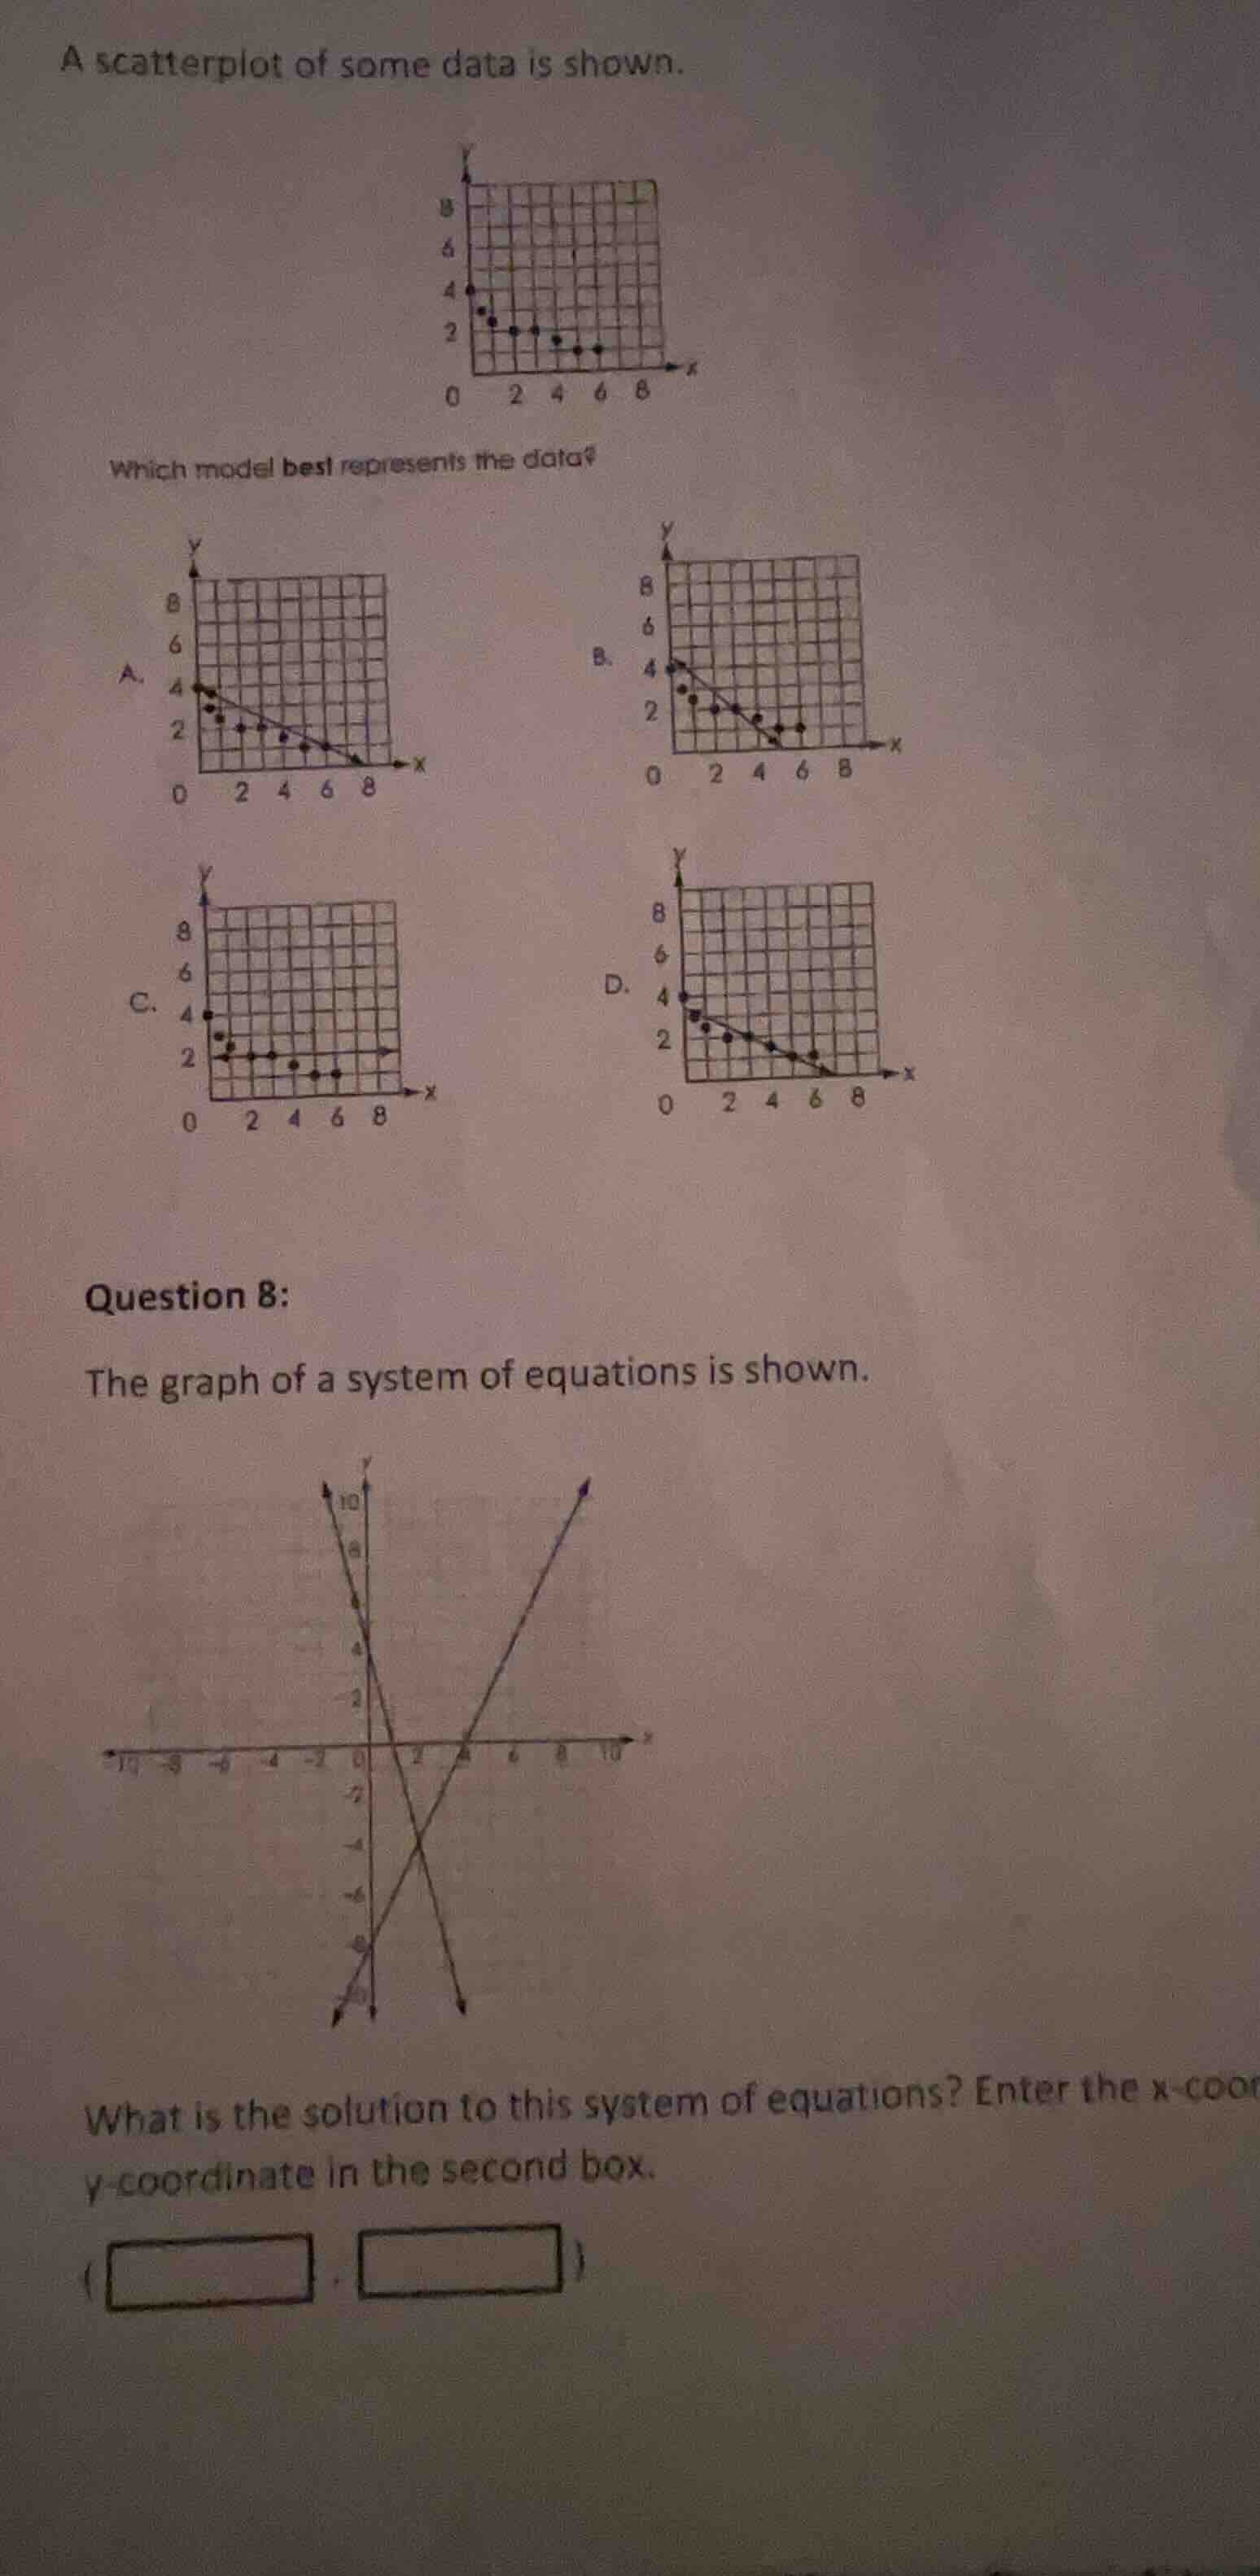
Question
a scatterplot of some data is shown.
which model best represents the data?
question 8:
the graph of a system of equations is shown.
what is the solution to this system of equations? enter the x-coordinate in the first box and the y-coordinate in the second box.
( , )
First Question (Scatterplot Model)
Compare the original scatterplot's data points to each option. The original data has y-values that decrease gradually and level off slightly, not dropping to 0 at x=8. Option A's line drops to 0, which doesn't match. Option B's line is too steep and also approaches 0. Option C has a flat trend that doesn't match the initial decrease. Option D's line follows the gradual downward trend of the original data points closely.
Step1: Identify intersection point
The solution of a system of linear equations is the point where the two lines intersect on the graph. Locate this point on the coordinate plane.
Step2: Read coordinates
From the graph, the lines intersect at $x=3$, $y=-5$.

Snap & solve any problem in the app
Get step-by-step solutions on Sovi AI
Photo-based solutions with guided steps
Explore more problems and detailed explanations
D. <The scatterplot model with a line that gradually decreases, matching the original data's trend>
---