QUESTION IMAGE
Question
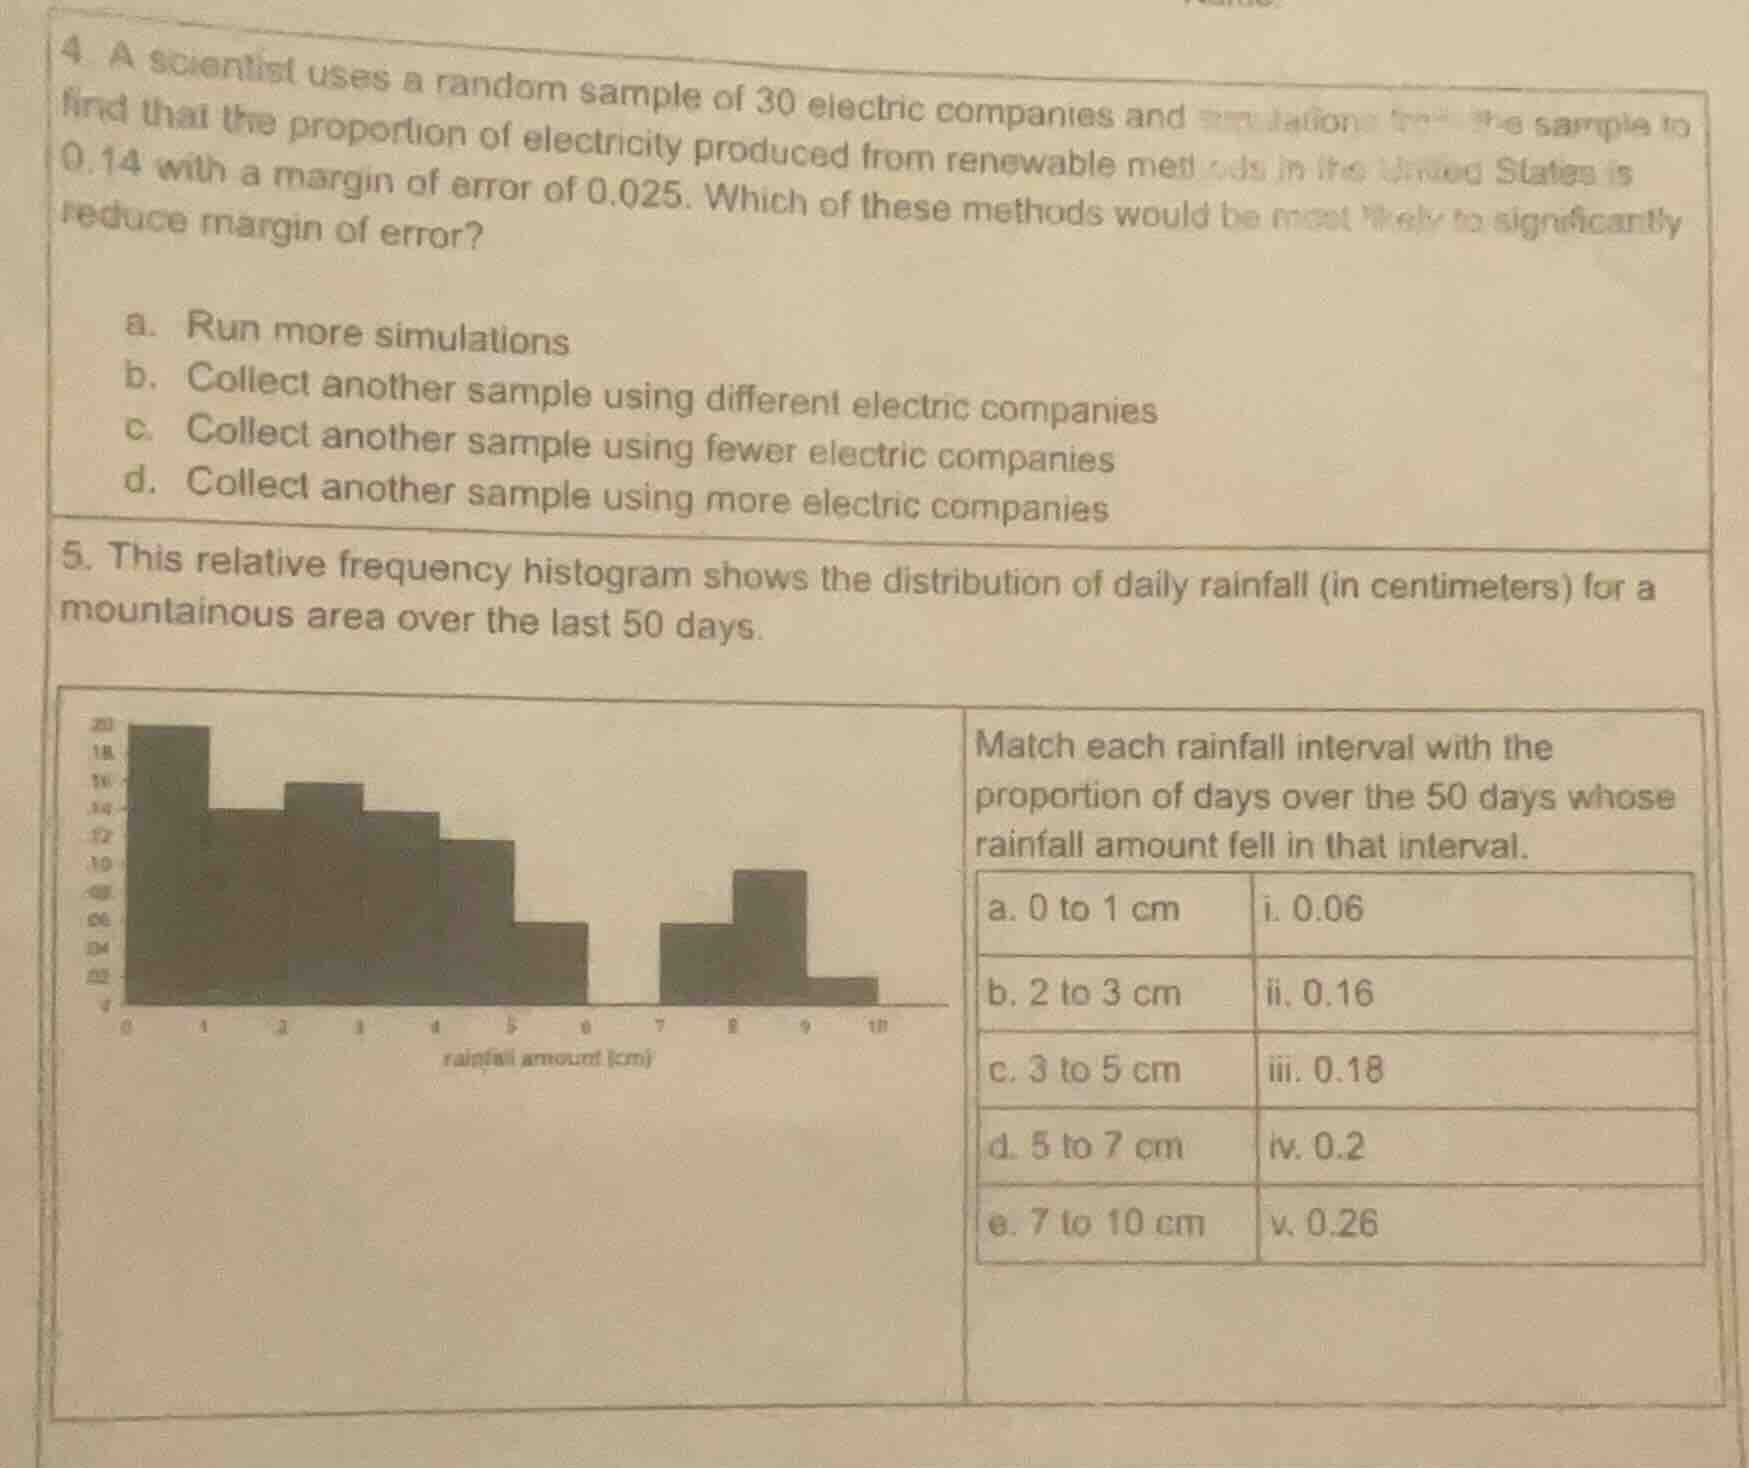
- a scientist uses a random sample of 30 electric companies and simulations from the sample to find that the proportion of electricity produced from renewable methods in the united states is 0.14 with a margin of error of 0.025. which of these methods would be most likely to significantly reduce margin of error?
a. run more simulations
b. collect another sample using different electric companies
c. collect another sample using fewer electric companies
d. collect another sample using more electric companies
- this relative frequency histogram shows the distribution of daily rainfall (in centimeters) for a mountainous area over the last 50 days.
match each rainfall interval with the proportion of days over the 50 days whose rainfall amount fell in that interval.
a. 0 to 1 cm \t i. 0.06
b. 2 to 3 cm \t ii. 0.16
c. 3 to 5 cm \t iii. 0.18
d. 5 to 7 cm \t iv. 0.2
e. 7 to 10 cm \t v. 0.26
Question 4
Step1: Recall margin of error relation
Margin of error is inversely related to sample size: $\text{Margin of Error} \propto \frac{1}{\sqrt{n}}$, where $n$ is sample size.
Step2: Identify method to reduce error
Increasing sample size ($n$) reduces margin of error. Collecting more companies increases $n$.
Question 5
Step1: Calculate total days per interval
Proportion = $\frac{\text{Number of days}}{50}$, so days = Proportion $\times$ 50.
Step2: Match intervals to counts
- 0-1 cm: Tallest bar = 13 days, $\frac{13}{50}=0.26$ (v)
- 2-3 cm: 10 days, $\frac{10}{50}=0.2$ (iv)
- 3-5 cm: 8 days, $\frac{8}{50}=0.16$ (ii)
- 5-7 cm: 3 days, $\frac{3}{50}=0.06$ (i)
- 7-10 cm: 9 days, $\frac{9}{50}=0.18$ (iii)

Snap & solve any problem in the app
Get step-by-step solutions on Sovi AI
Photo-based solutions with guided steps
Explore more problems and detailed explanations
- d. Collect another sample using more electric companies
- a. 0 to 1 cm - v. 0.26
b. 2 to 3 cm - iv. 0.2
c. 3 to 5 cm - ii. 0.16
d. 5 to 7 cm - i. 0.06
e. 7 to 10 cm - iii. 0.18