QUESTION IMAGE
Question
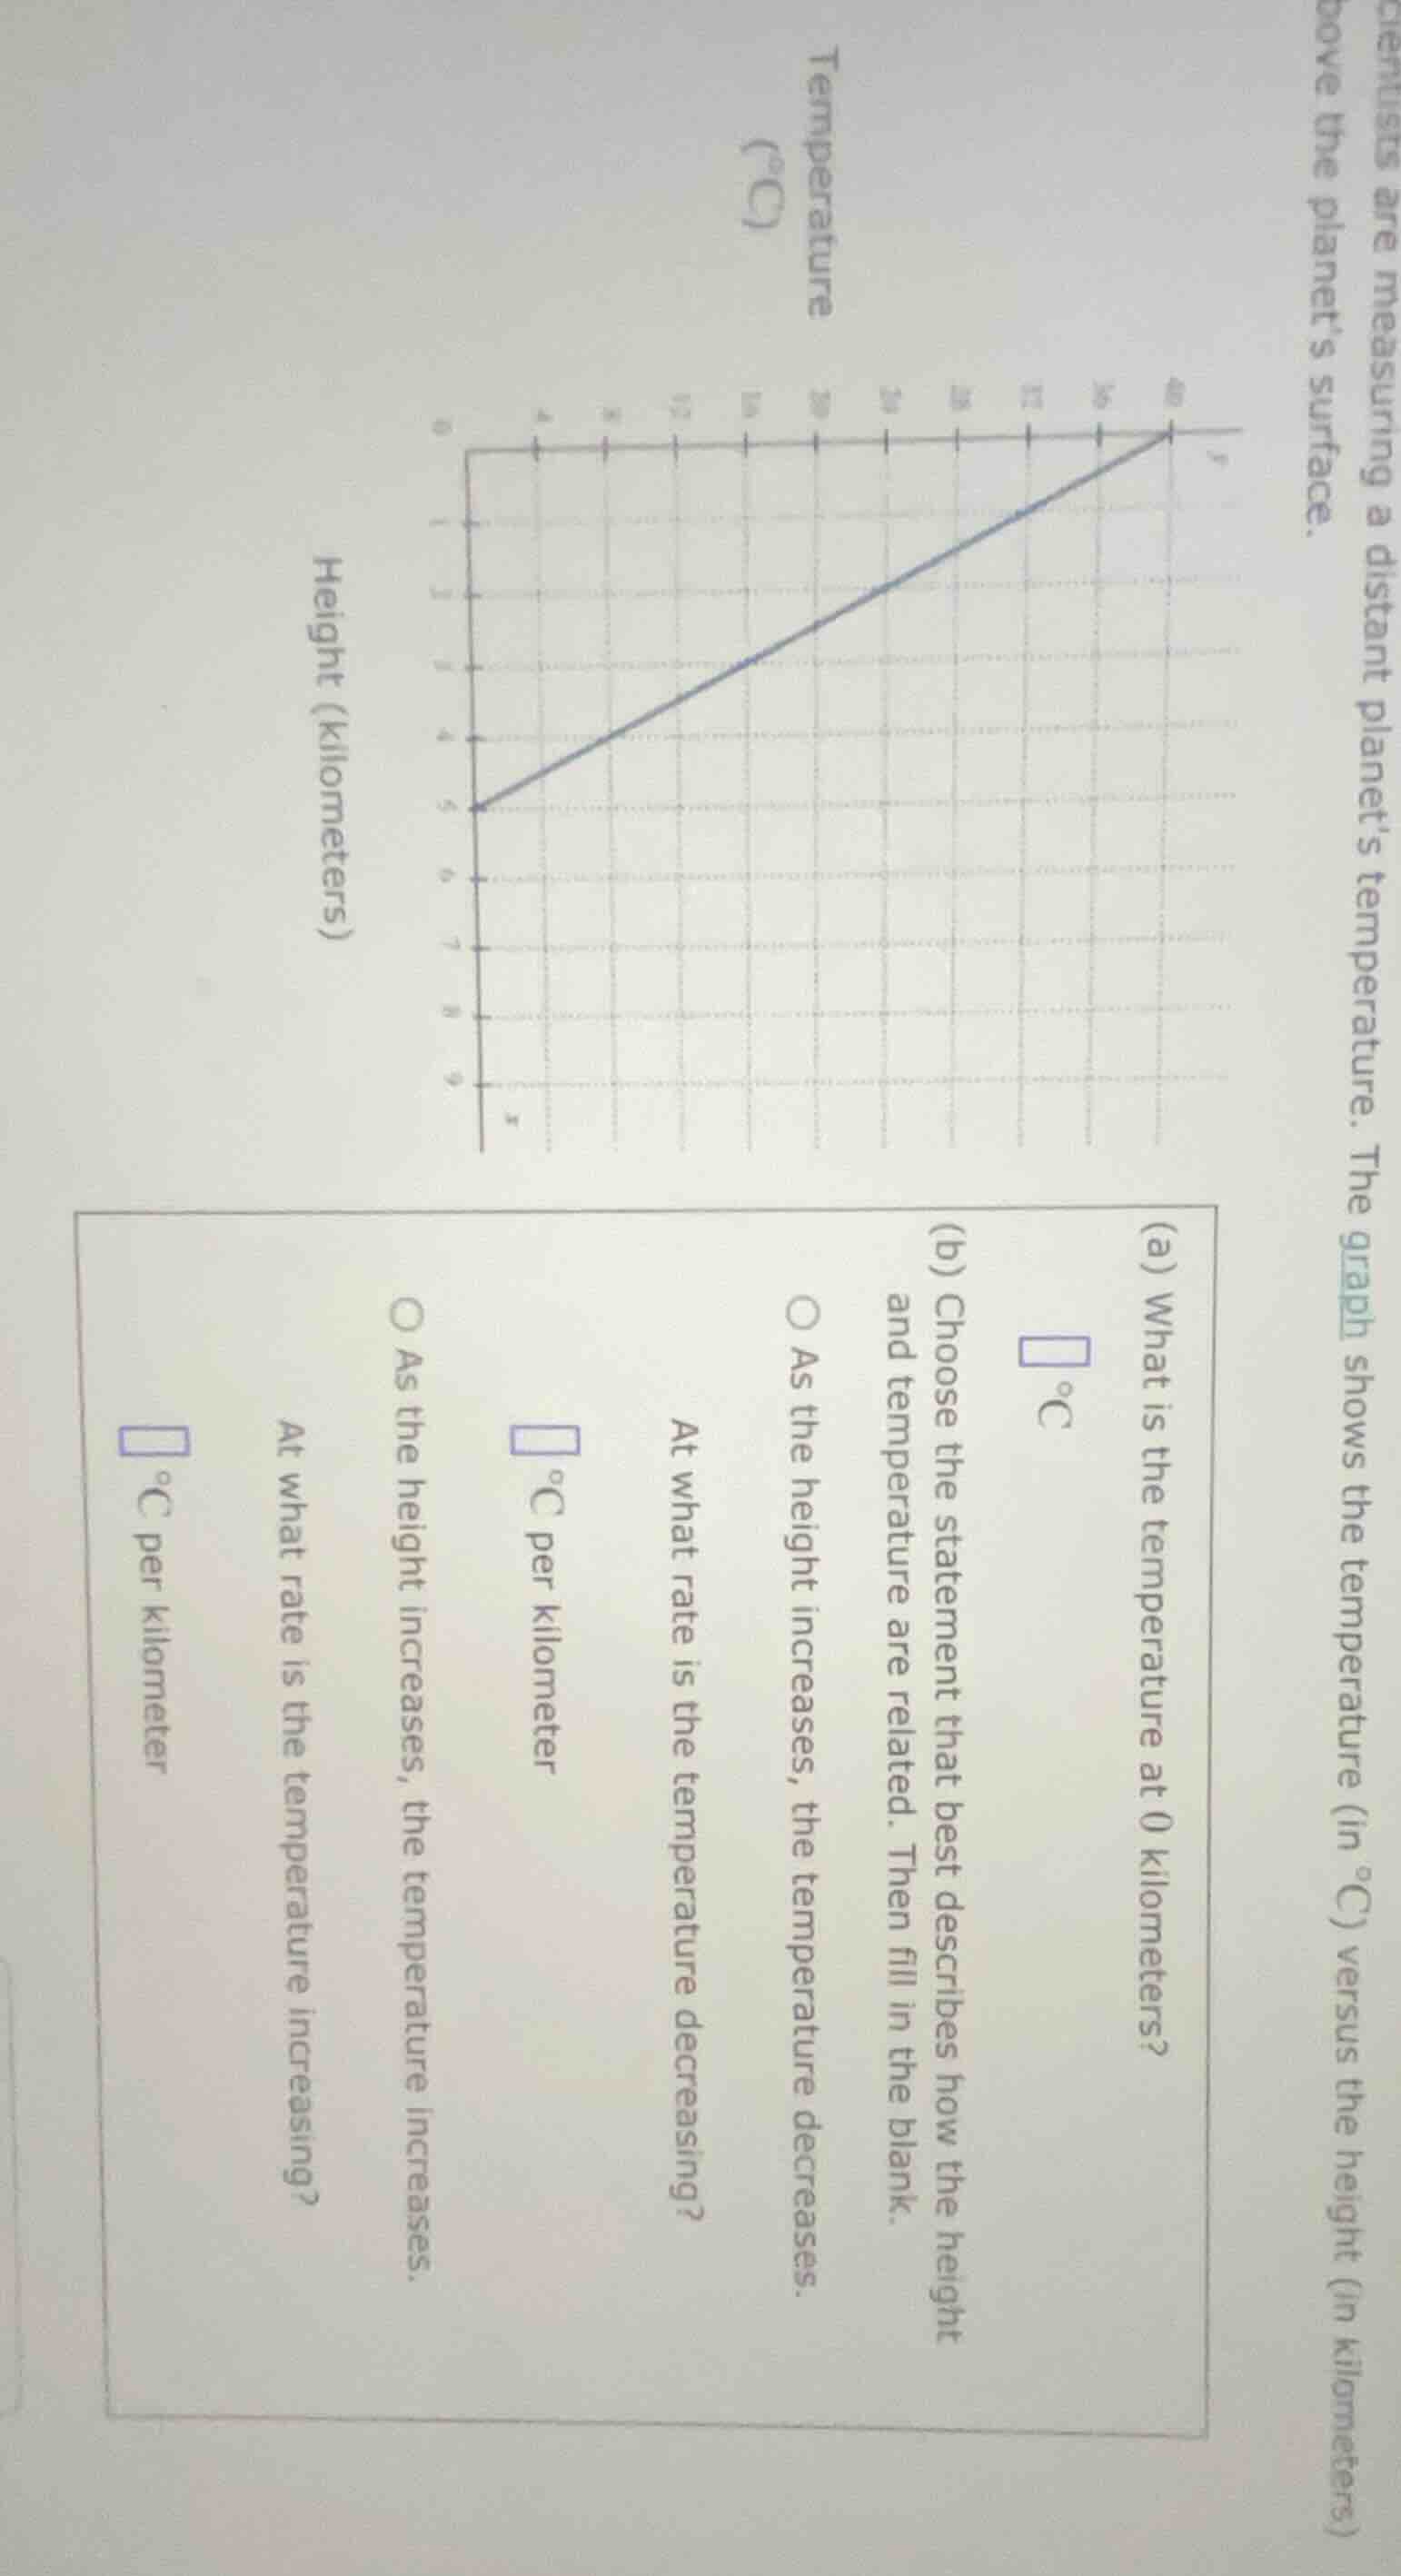
scientists are measuring a distant planet’s temperature. the graph shows the temperature (in °c) versus the height (in kilometers) above the planet’s surface.
(a) what is the temperature at 0 kilometers?
(square) °c
(b) choose the statement that best describes how the height and temperature are related. then fill in the blank.
(\bigcirc) as the height increases, the temperature decreases.
at what rate is the temperature decreasing?
(square) °c per kilometer
(\bigcirc) as the height increases, the temperature increases.
at what rate is the temperature increasing?
(square) °c per kilometer
Step1: Find temp at 0 km
From the graph, at height $x=0$ km, the temperature $y=40^\circ\text{C}$.
Step2: Identify relationship trend
Observe the graph: as height increases, temperature falls. So select "As the height increases, the temperature decreases."
Step3: Calculate rate of change
Use two points: $(0, 40)$ and $(5, 4)$. Rate = $\frac{\text{Change in Temp}}{\text{Change in Height}} = \frac{4 - 40}{5 - 0} = \frac{-36}{5} = -7.2$. The negative sign means decreasing at $7.2^\circ\text{C}$ per kilometer.

Snap & solve any problem in the app
Get step-by-step solutions on Sovi AI
Photo-based solutions with guided steps
Explore more problems and detailed explanations
(a) $40$
(b)
- Selected statement: As the height increases, the temperature decreases.
- Rate of temperature decrease: $7.2$ °C per kilometer