QUESTION IMAGE
Question
(score for question 1: ___ of 8 points)
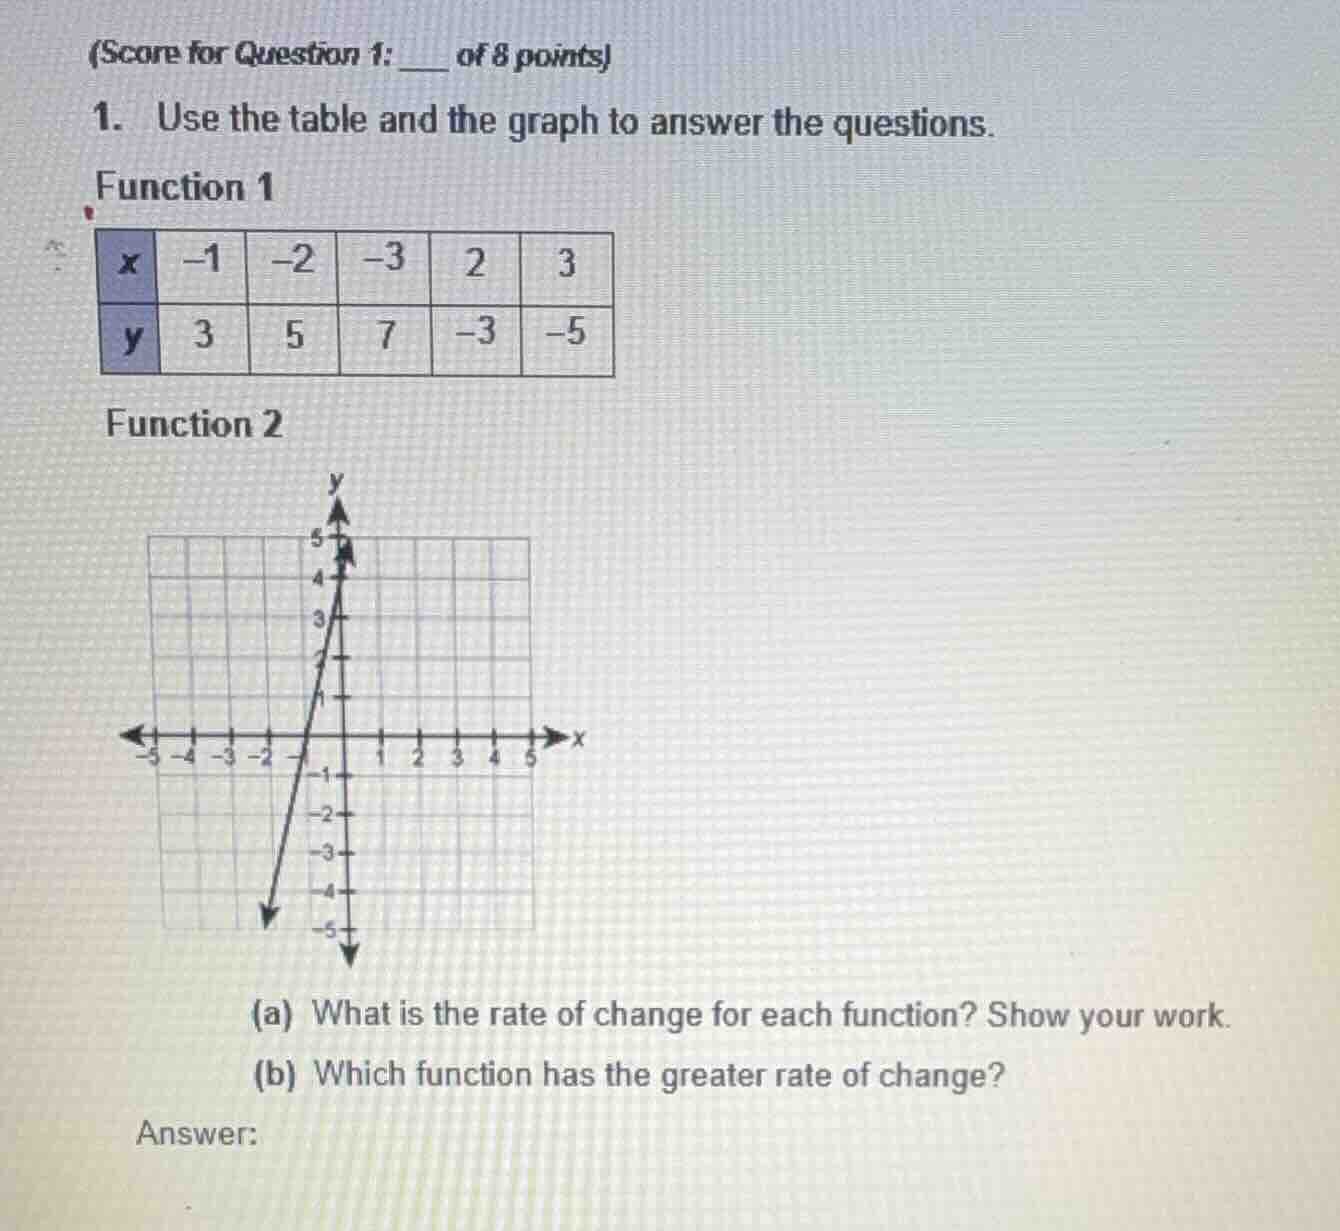
- use the table and the graph to answer the questions.
function 1
| x | -1 | -2 | -3 | 2 | 3 |
| y | 3 | 5 | 7 | -3 | -5 |
function 2
graph of a line in a coordinate plane with x-axis from -5 to 5 and y-axis from -5 to 5, passing through points, for example, (-1, -2) and (0, 4) (approximate based on the graph)
(a) what is the rate of change for each function? show your work.
(b) which function has the greater rate of change?
answer:
Step1: Calculate rate of change for Function 1
The rate of change (slope) for a linear function is $\frac{y_2 - y_1}{x_2 - x_1}$. Use points $(-1, 3)$ and $(-2, 5)$:
$\frac{5 - 3}{-2 - (-1)} = \frac{2}{-1} = -2$
Step2: Calculate rate of change for Function 2
Use two points from the graph, e.g., $(0, 4)$ and $(1, 7)$:
$\frac{7 - 4}{1 - 0} = \frac{3}{1} = 3$
Step3: Compare the two rates of change
The absolute value of $3$ is greater than the absolute value of $-2$. When comparing the "greater" rate of change (magnitude), $3 > |-2|$.

Snap & solve any problem in the app
Get step-by-step solutions on Sovi AI
Photo-based solutions with guided steps
Explore more problems and detailed explanations
(a) Rate of change for Function 1: $-2$; Rate of change for Function 2: $3$
(b) Function 2 has the greater rate of change.