QUESTION IMAGE
Question
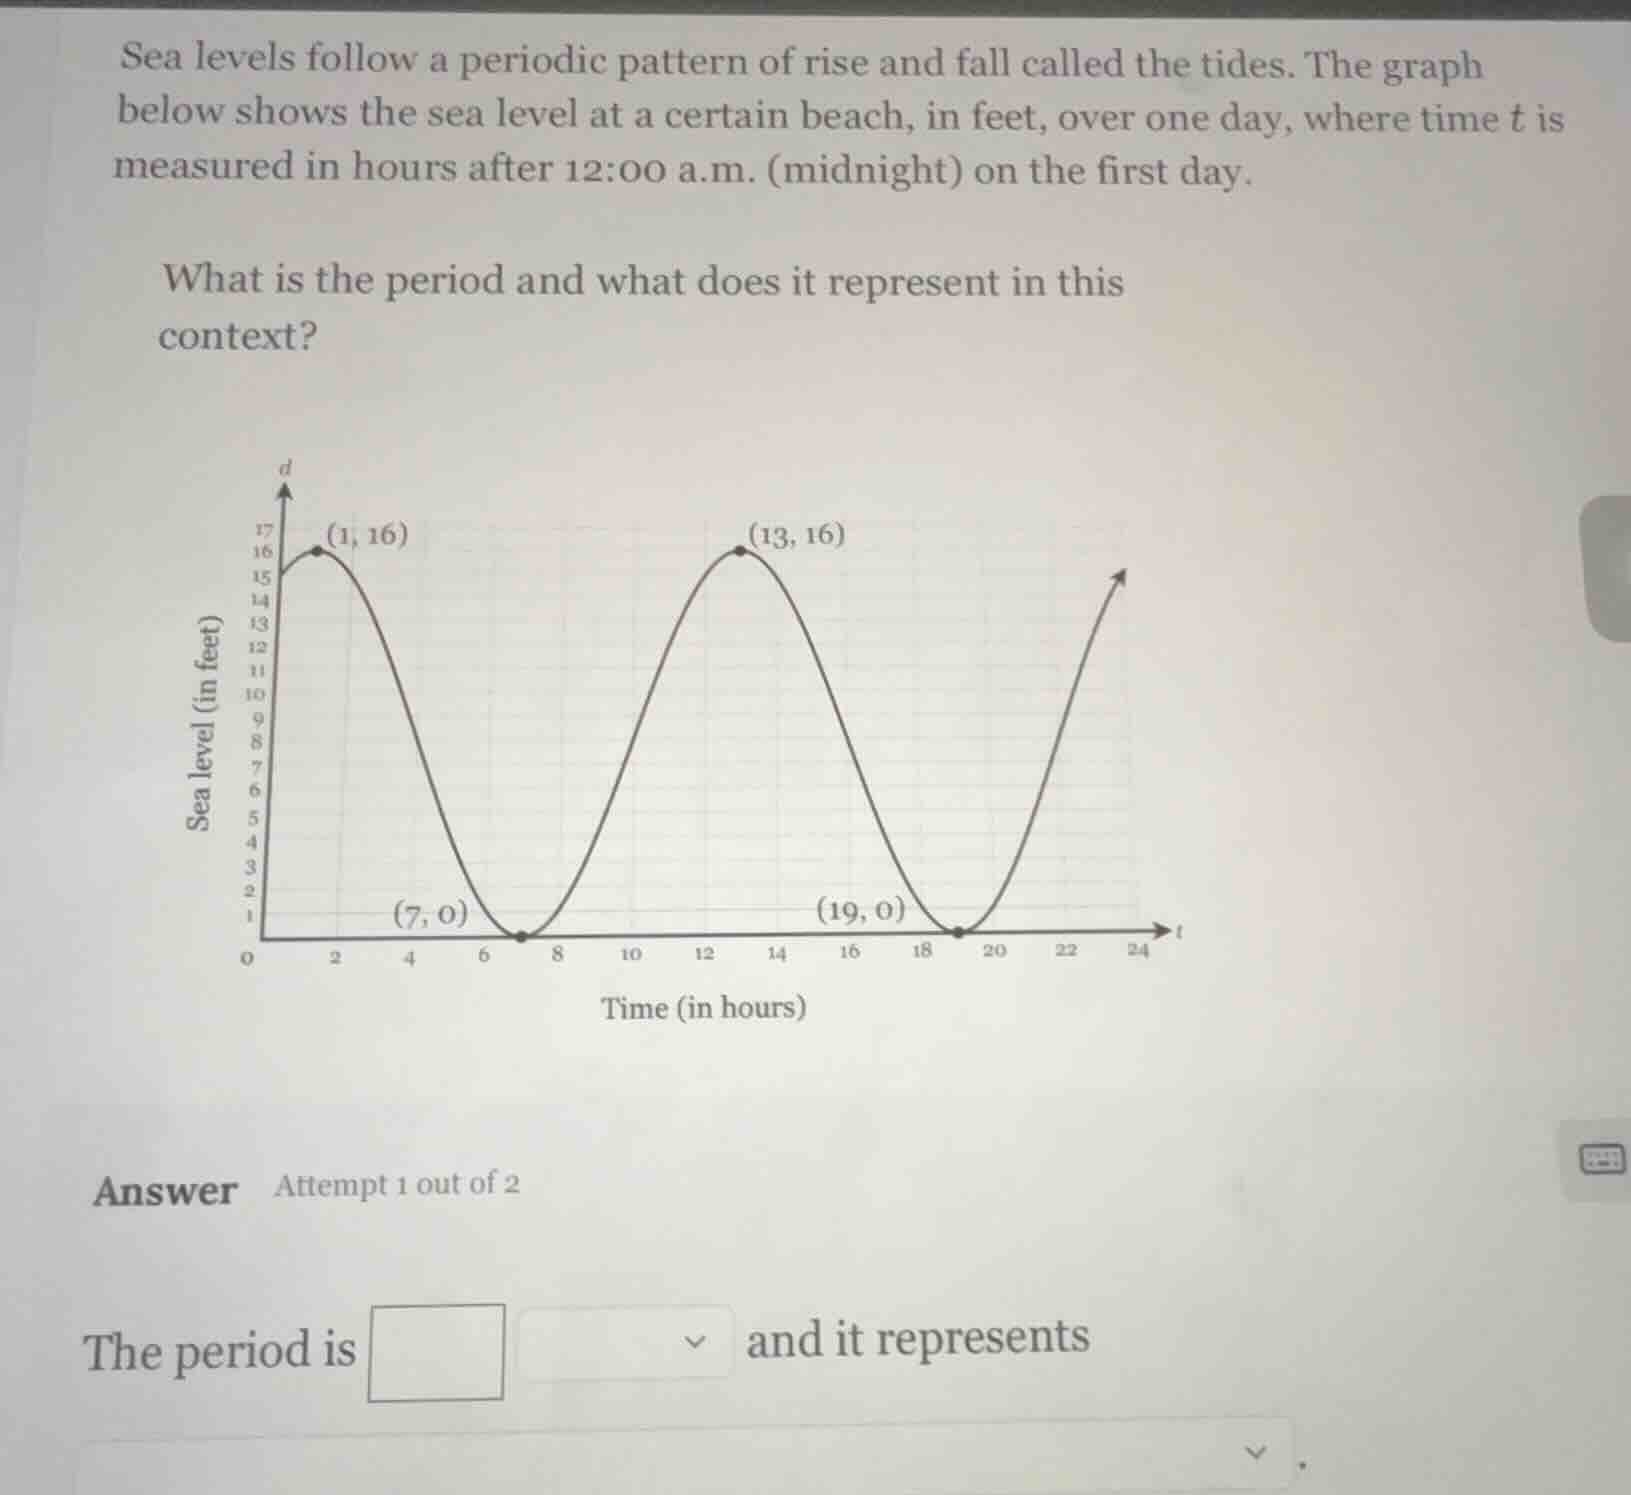
sea levels follow a periodic pattern of rise and fall called the tides. the graph below shows the sea level at a certain beach, in feet, over one day, where time t is measured in hours after 12:00 a.m. (midnight) on the first day. what is the period and what does it represent in this context? answer attempt 1 out of 2 the period is and it represents
Step1: Identify peak time difference
The first peak is at $t=1$ hours, the next peak is at $t=13$ hours. Calculate the difference:
$13 - 1 = 12$
Step2: Verify with trough time difference
The first trough is at $t=7$ hours, the next trough is at $t=19$ hours. Calculate the difference:
$19 - 7 = 12$
Step3: Interpret the period context
The period is the time for one full tide cycle (rise and fall).

Snap & solve any problem in the app
Get step-by-step solutions on Sovi AI
Photo-based solutions with guided steps
Explore more problems and detailed explanations
The period is 12 hours and it represents the time it takes for the sea level to complete one full cycle of rising to a high tide, falling to a low tide, and returning to the starting level.