QUESTION IMAGE
Question
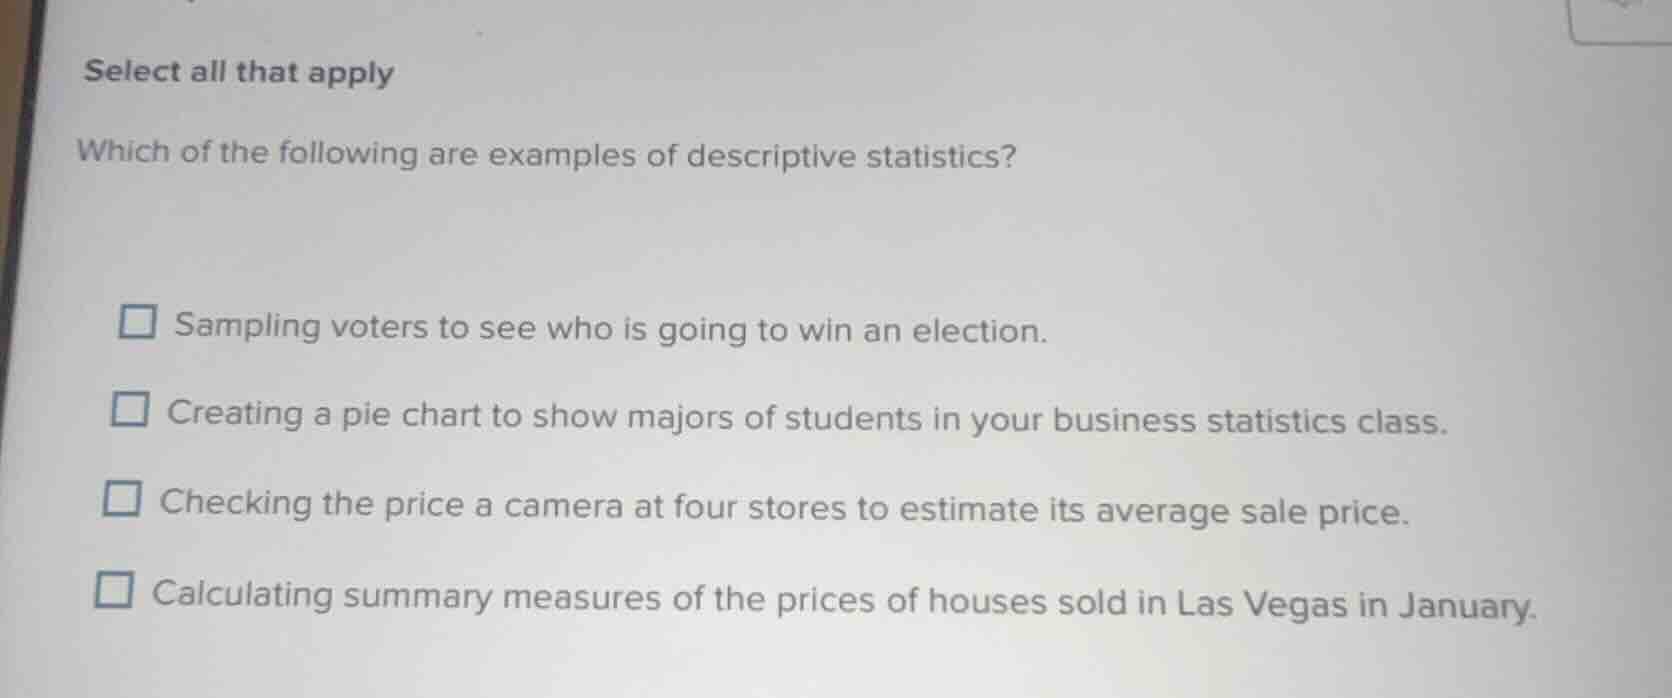
select all that apply
which of the following are examples of descriptive statistics?
□ sampling voters to see who is going to win an election.
□ creating a pie chart to show majors of students in your business statistics class.
□ checking the price a camera at four stores to estimate its average sale price.
□ calculating summary measures of the prices of houses sold in las vegas in january.
Descriptive statistics summarize or visualize existing, complete data sets, rather than inferring about a larger population.
- Sampling voters to predict an election uses sample data to infer about the entire voter population, which is inferential statistics, not descriptive.
- A pie chart showing class majors summarizes data from the specific class (a complete set for that group), so this is descriptive statistics.
- Checking 4 stores to estimate the average camera price uses a sample to infer the overall average, which is inferential statistics.
- Calculating summary measures for all houses sold in Las Vegas in January summarizes a complete, specific data set, so this is descriptive statistics.

Snap & solve any problem in the app
Get step-by-step solutions on Sovi AI
Photo-based solutions with guided steps
Explore more problems and detailed explanations
B. Creating a pie chart to show majors of students in your business statistics class.
D. Calculating summary measures of the prices of houses sold in Las Vegas in January.