QUESTION IMAGE
Question
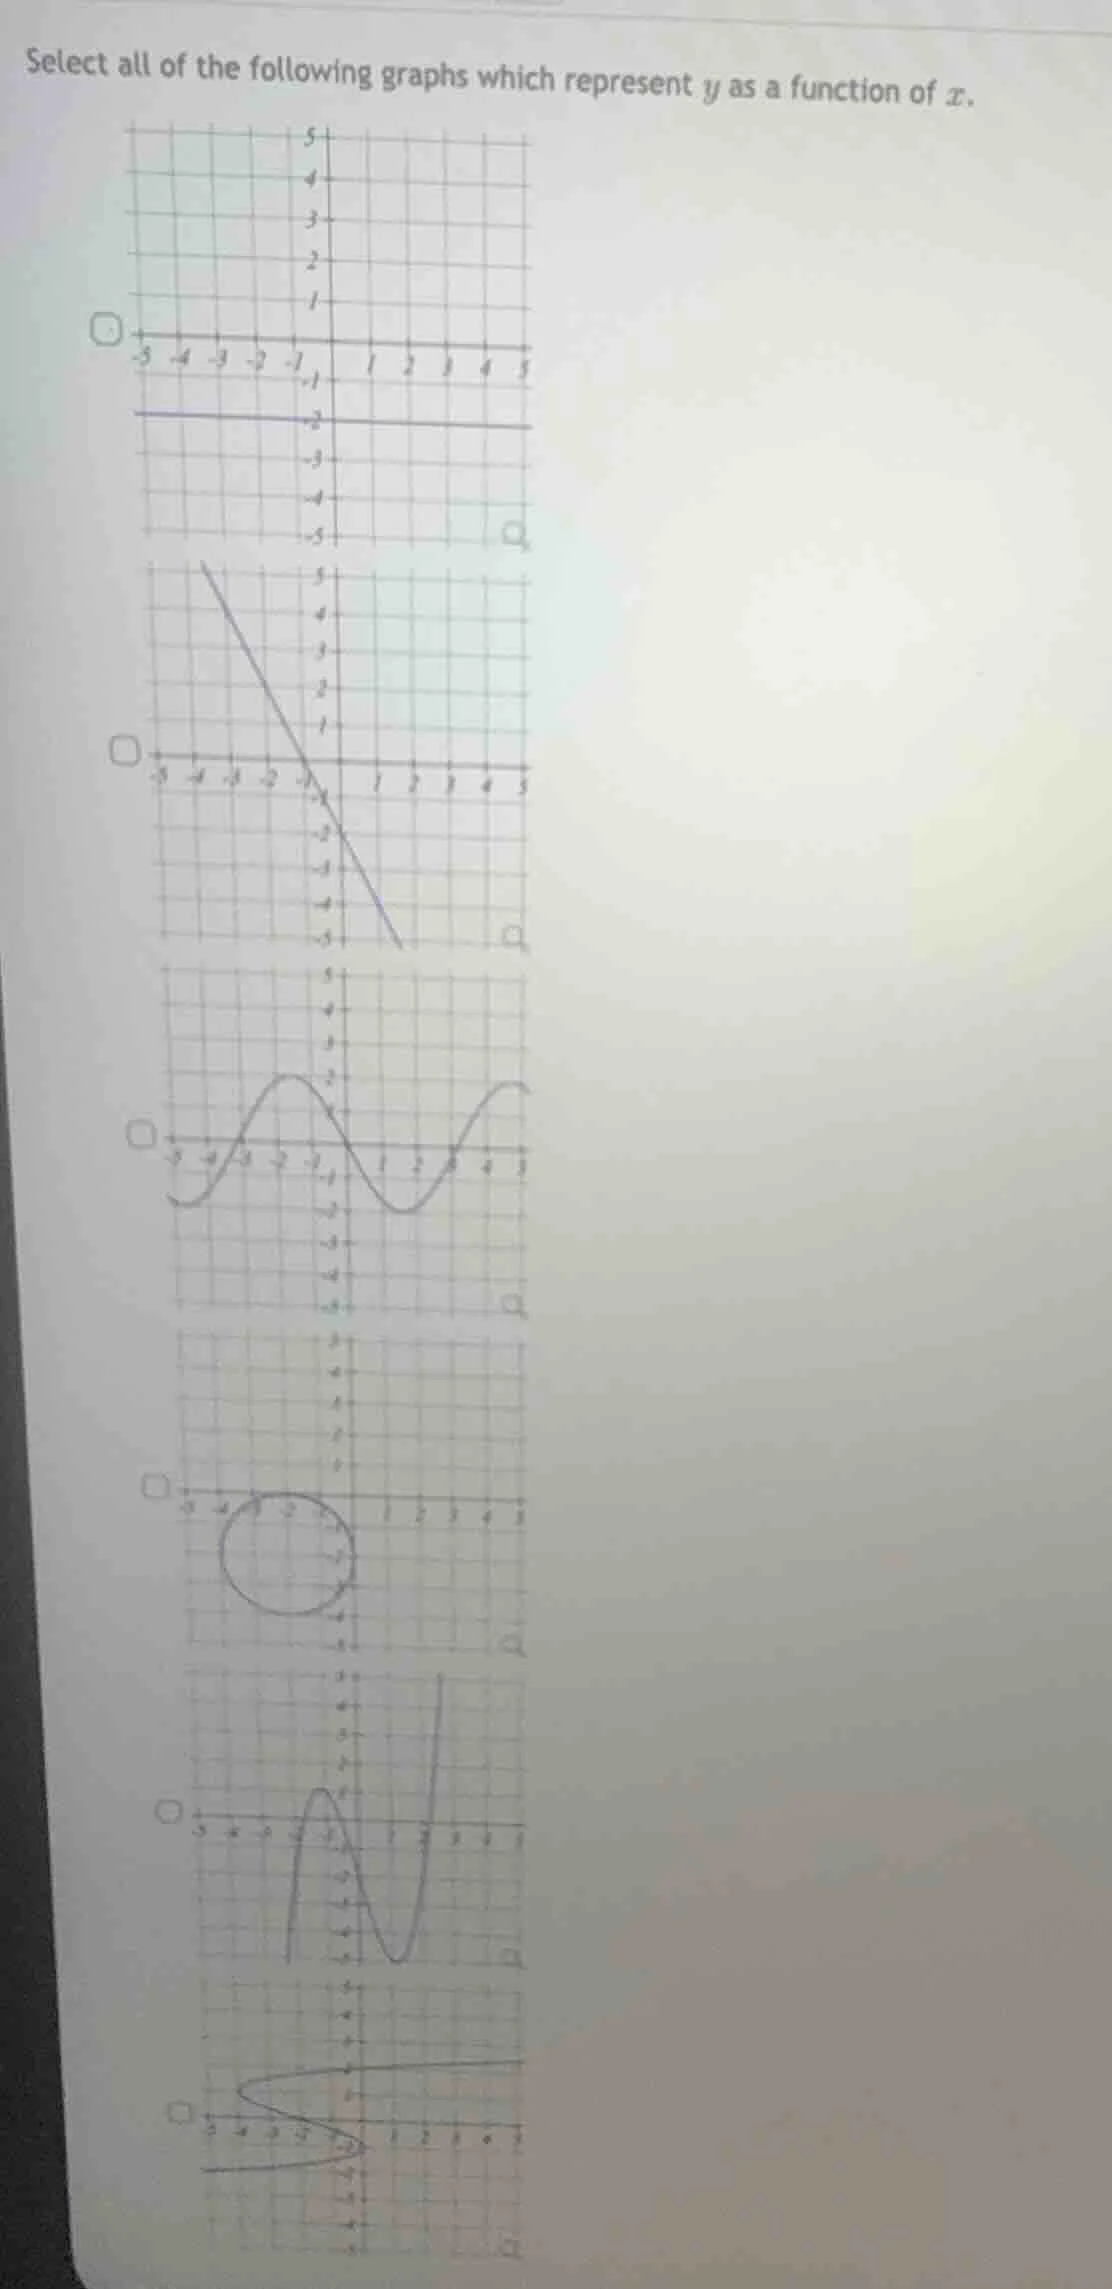
select all of the following graphs which represent y as a function of x.
To determine if a graph represents \( y \) as a function of \( x \), we use the vertical line test: a graph is a function if no vertical line intersects the graph more than once.
Step 1: Analyze the first graph (horizontal line)
A horizontal line has the same \( y \)-value for all \( x \). Any vertical line will intersect it at exactly one point. So, it passes the vertical line test.
Step 2: Analyze the second graph (straight line with slope)
A straight line (non-vertical) has a unique \( y \)-value for each \( x \). Any vertical line will intersect it at exactly one point. So, it passes the vertical line test.
Step 3: Analyze the third graph (wave/curve)
This wave-like graph has a unique \( y \)-value for each \( x \) (no vertical line intersects it more than once). So, it passes the vertical line test.
Step 4: Analyze the fourth graph (circle)
A circle is symmetric about its center. A vertical line through the circle will intersect it at two points (e.g., the left and right halves). So, it fails the vertical line test.
Step 5: Analyze the fifth graph (parabola-like curve)
This curve has a unique \( y \)-value for each \( x \) (no vertical line intersects it more than once). So, it passes the vertical line test.
Step 6: Analyze the sixth graph (S-shaped curve)
This S-shaped curve has at least one vertical line that intersects it more than once (e.g., near the center). So, it fails the vertical line test.
The graphs that represent \( y \) as a function of \( x \) are the first, second, third, and fifth graphs.

Snap & solve any problem in the app
Get step-by-step solutions on Sovi AI
Photo-based solutions with guided steps
Explore more problems and detailed explanations
The graphs (from top to bottom) that represent \( y \) as a function of \( x \) are the 1st, 2nd, 3rd, and 5th graphs (select their corresponding checkboxes).