QUESTION IMAGE
Question
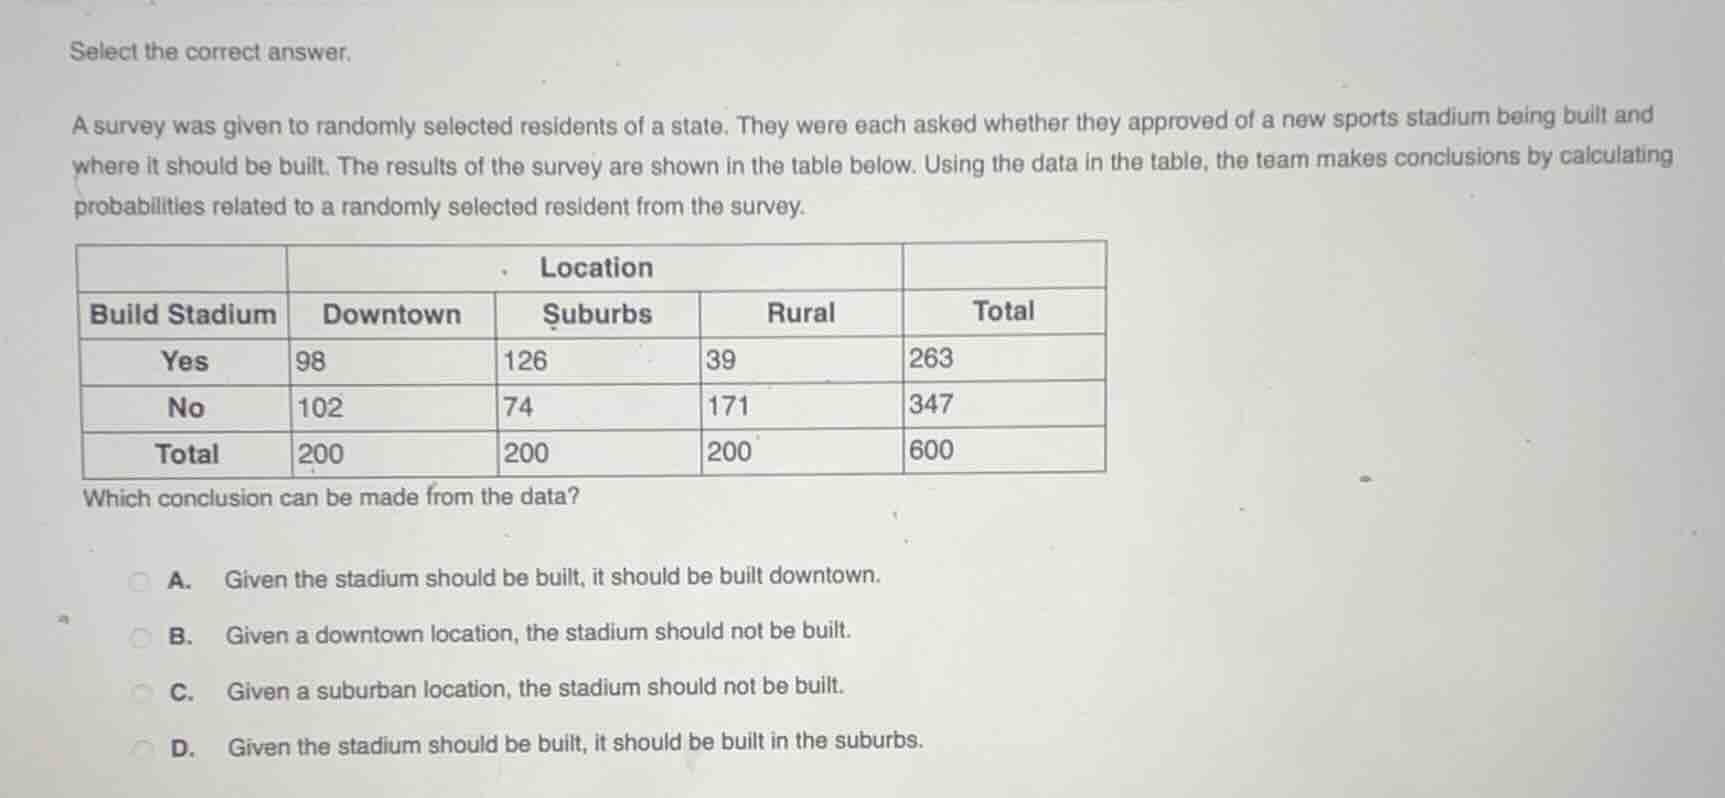
select the correct answer.
a survey was given to randomly selected residents of a state. they were each asked whether they approved of a new sports stadium being built and where it should be built. the results of the survey are shown in the table below. using the data in the table, the team makes conclusions by calculating probabilities related to a randomly selected resident from the survey.
| location | ||||
| build stadium | downtown | suburbs | rural | total |
| yes | 98 | 126 | 39 | 263 |
| no | 102 | 74 | 171 | 347 |
| total | 200 | 200 | 200 | 600 |
which conclusion can be made from the data?
a. given the stadium should be built, it should be built downtown.
b. given a downtown location, the stadium should not be built.
c. given a suburban location, the stadium should not be built.
d. given the stadium should be built, it should be built in the suburbs.
Step1: Calculate P(Downtown|Yes)
$\frac{98}{263} \approx 0.373$
Step2: Calculate P(Suburbs|Yes)
$\frac{126}{263} \approx 0.479$
Step3: Calculate P(Rural|Yes)
$\frac{39}{263} \approx 0.148$
Step4: Calculate P(No|Downtown)
$\frac{102}{200} = 0.51$
Step5: Calculate P(No|Suburbs)
$\frac{74}{200} = 0.37$

Snap & solve any problem in the app
Get step-by-step solutions on Sovi AI
Photo-based solutions with guided steps
Explore more problems and detailed explanations
D. Given the stadium should be built, it should be built in the suburbs.