QUESTION IMAGE
Question
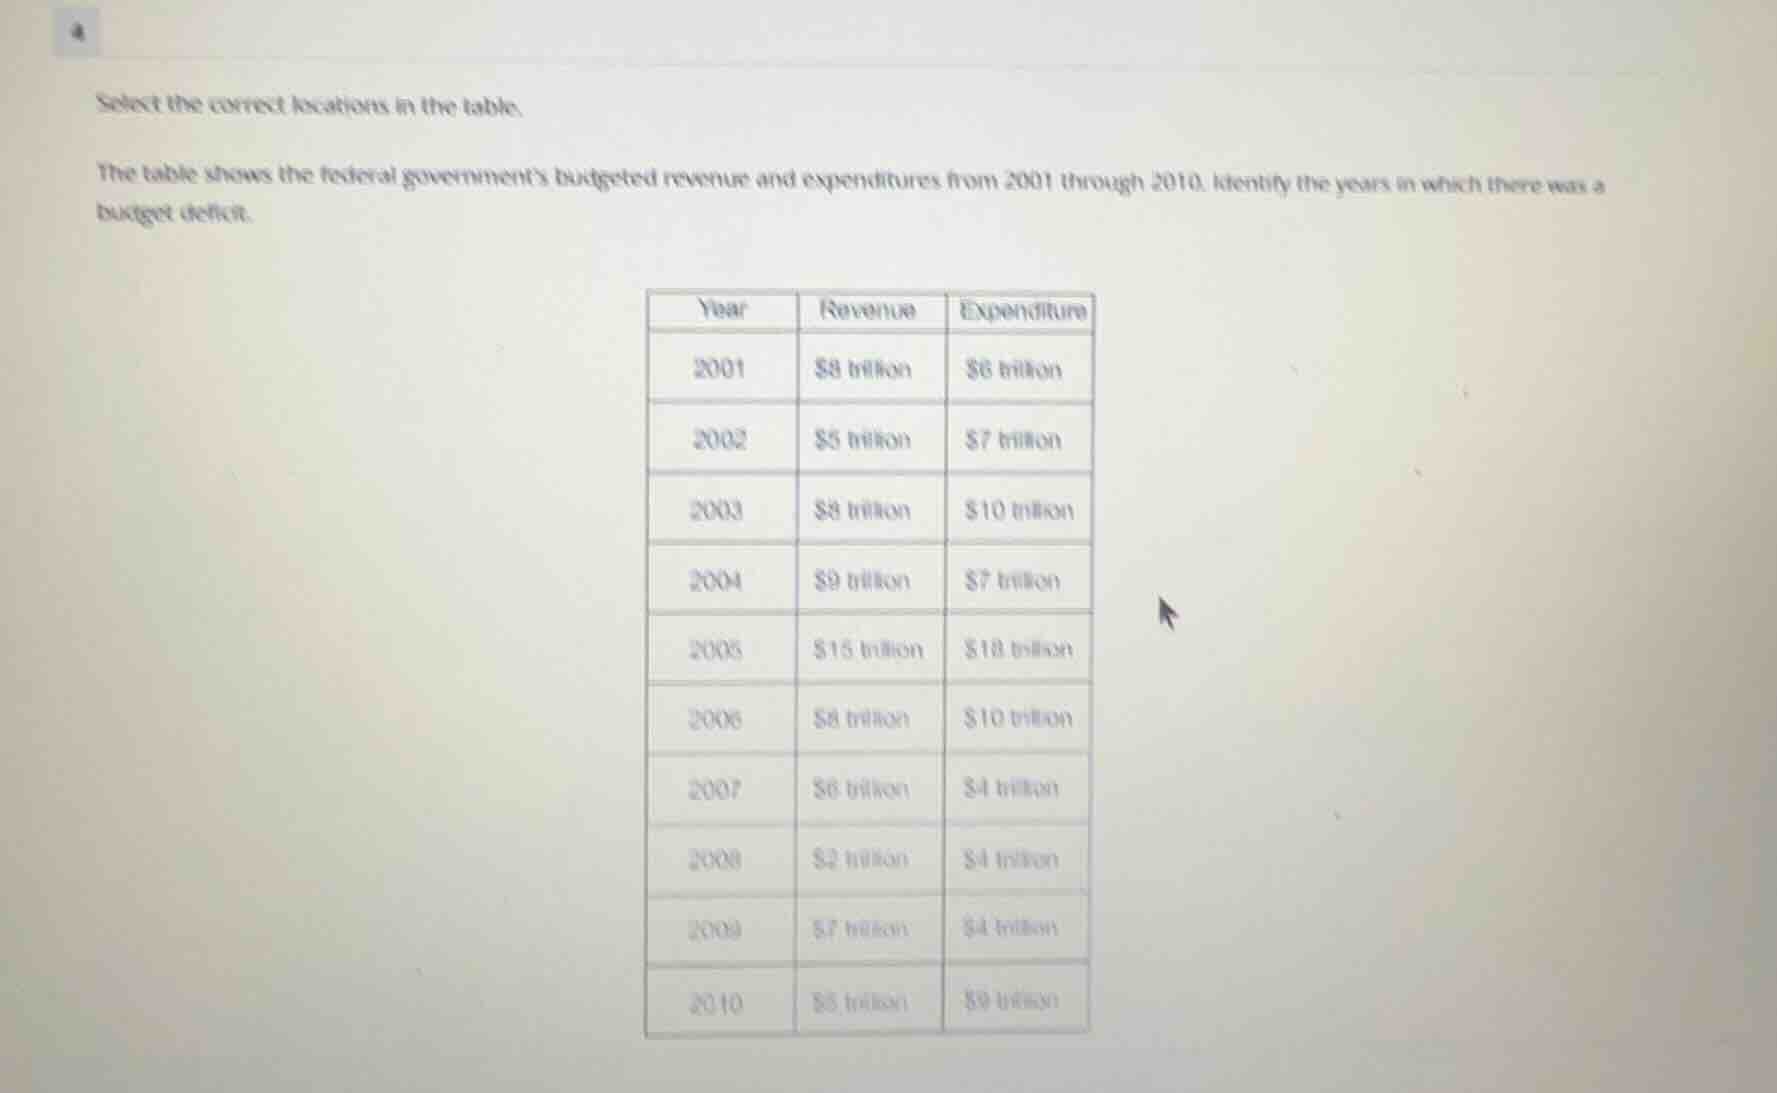
select the correct locations in the table.
the table shows the federal government’s budgeted revenue and expenditures from 2001 through 2010. identify the years in which there was a budget deficit.
| year | revenue | expenditure |
|---|---|---|
| 2002 | $5 trillion | $7 trillion |
| 2003 | $8 trillion | $10 trillion |
| 2004 | $9 trillion | $7 trillion |
| 2005 | $15 trillion | $18 trillion |
| 2006 | $8 trillion | $10 trillion |
| 2007 | $6 trillion | $4 trillion |
| 2008 | $2 trillion | $4 trillion |
| 2009 | $7 trillion | $4 trillion |
| 2010 | $5 trillion | $9 trillion |
Step1: Define Budget Deficit
A budget deficit occurs when Expenditure > Revenue.
Step2: Check 2001
Revenue = $8 trillion, Expenditure = $6 trillion. $8 > $6 → No deficit.
Step3: Check 2002
Revenue = $5 trillion, Expenditure = $7 trillion. $5 < $7 → Deficit.
Step4: Check 2003
Revenue = $8 trillion, Expenditure = $10 trillion. $8 < $10 → Deficit.
Step5: Check 2004
Revenue = $9 trillion, Expenditure = $7 trillion. $9 > $7 → No deficit.
Step6: Check 2005
Revenue = $15 trillion, Expenditure = $18 trillion. $15 < $18 → Deficit.
Step7: Check 2006
Revenue = $8 trillion, Expenditure = $10 trillion. $8 < $10 → Deficit.
Step8: Check 2007
Revenue = $6 trillion, Expenditure = $4 trillion. $6 > $4 → No deficit.
Step9: Check 2008
Revenue = $2 trillion, Expenditure = $4 trillion. $2 < $4 → Deficit.
Step10: Check 2009
Revenue = $7 trillion, Expenditure = $4 trillion. $7 > $4 → No deficit.
Step11: Check 2010
Revenue = $5 trillion, Expenditure = $9 trillion. $5 < $9 → Deficit.

Snap & solve any problem in the app
Get step-by-step solutions on Sovi AI
Photo-based solutions with guided steps
Explore more problems and detailed explanations
The years with a budget deficit are 2002, 2003, 2005, 2006, 2008, 2010.