QUESTION IMAGE
Question
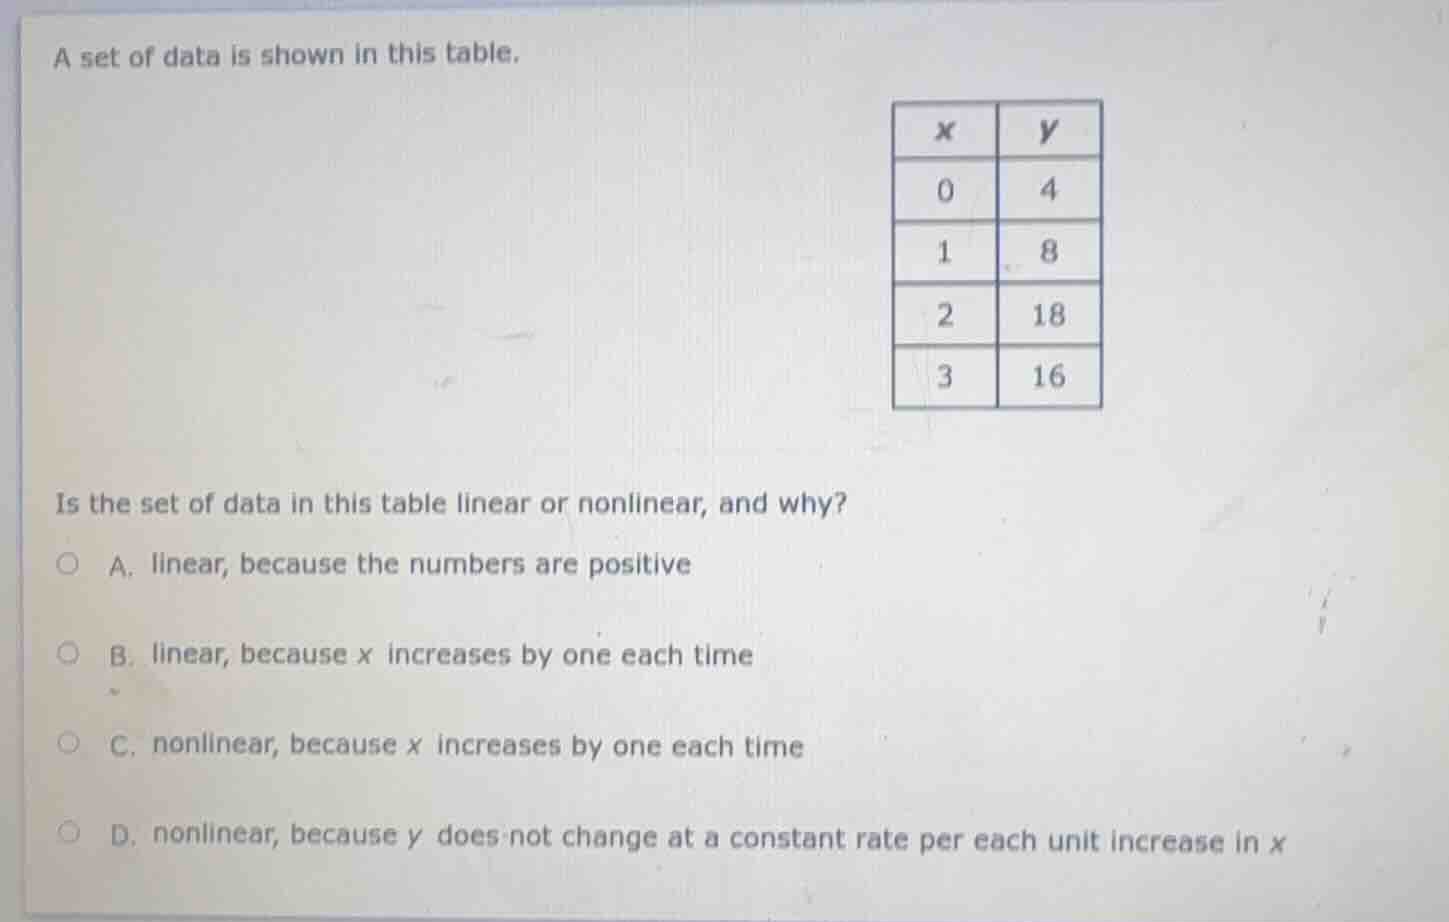
a set of data is shown in this table.
x | y
0 | 4
1 | 8
2 | 18
3 | 16
is the set of data in this table linear or nonlinear, and why?
a. linear, because the numbers are positive
b. linear, because x increases by one each time
c. nonlinear, because x increases by one each time
d. nonlinear, because y does not change at a constant rate per each unit increase in x
To determine if the data is linear or nonlinear, we check the rate of change of \( y \) with respect to \( x \). For linear data, the change in \( y \) (slope) should be constant for each unit increase in \( x \).
- From \( x = 0 \) to \( x = 1 \): \( \Delta y = 8 - 4 = 4 \)
- From \( x = 1 \) to \( x = 2 \): \( \Delta y = 18 - 8 = 10 \)
- From \( x = 2 \) to \( x = 3 \): \( \Delta y = 16 - 18 = -2 \)
The changes in \( y \) are not constant, so the data is nonlinear. Option A is wrong (positivity doesn’t determine linearity), Option B is wrong (x increasing by 1 doesn’t ensure linearity—linearity requires constant \( \Delta y \)), Option C is wrong (x increasing by 1 isn’t the reason for nonlinearity; the reason is non - constant \( \Delta y \)). Option D correctly states the data is nonlinear because \( y \) doesn’t change at a constant rate per unit increase in \( x \).

Snap & solve any problem in the app
Get step-by-step solutions on Sovi AI
Photo-based solutions with guided steps
Explore more problems and detailed explanations
D. nonlinear, because y does not change at a constant rate per each unit increase in x