QUESTION IMAGE
Question
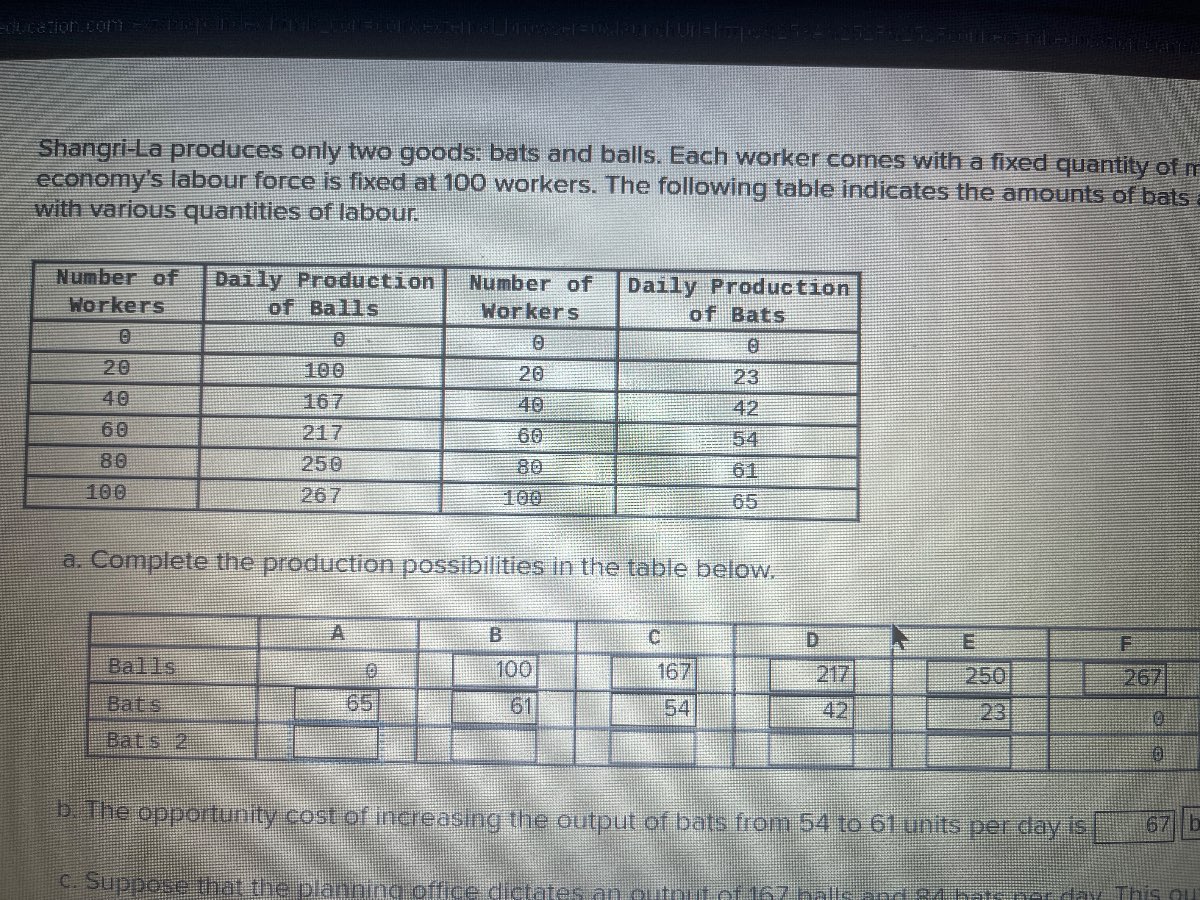
shangri - la produces only two goods: bats and balls. each worker comes with a fixed quantity of m economys labour force is fixed at 100 workers. the following table indicates the amounts of bats a with various quantities of labour.
| number of workers | daily production of balls | number of workers | daily production of bats |
|---|---|---|---|
| 20 | 100 | 20 | 23 |
| 40 | 167 | 40 | 42 |
| 60 | 217 | 60 | 54 |
| 80 | 250 | 80 | 61 |
| 100 | 267 | 100 | 65 |
a. complete the production possibilities in the table below.
| a | b | c | d | e | f | |
|---|---|---|---|---|---|---|
| bats | 65 | 61 | 54 | 42 | 23 | 0 |
| bats 2 | 0 |
b. the opportunity cost of increasing the output of bats from 54 to 61 units per day is 67 b
c. suppose that the planning office dictates an output of 167 balls and 84 bats per day. this o
Part a: Completing the Production Possibilities Table
To complete the table, we analyze the labor allocation. The total labor force is 100 workers. For each row (A to F), the number of workers producing balls and bats must sum to 100. We use the given production tables to find the corresponding production of the other good.
- Row A: Balls = 0 (0 workers). So, 100 workers produce bats. From the bats table, 100 workers produce 65 bats.
- Row B: Balls = 100 (20 workers). So, 100 - 20 = 80 workers produce bats. From the bats table, 80 workers produce 61 bats.
- Row C: Balls = 167 (40 workers). So, 100 - 40 = 60 workers produce bats. From the bats table, 60 workers produce 54 bats.
- Row D: Balls = 217 (60 workers). So, 100 - 60 = 40 workers produce bats. From the bats table, 40 workers produce 42 bats.
- Row E: Balls = 250 (80 workers). So, 100 - 80 = 20 workers produce bats. From the bats table, 20 workers produce 23 bats.
- Row F: Balls = 267 (100 workers). So, 0 workers produce bats. From the bats table, 0 workers produce 0 bats.
Part b: Opportunity Cost of Bats (54 to 61 units)
Opportunity cost is the decrease in balls production when bats production increases.
- Bats = 54: From the balls table, 60 workers produce 217 balls (since 100 - 60 = 40 workers produce bats for 54 bats).
- Bats = 61: From the balls table, 80 workers produce 250 balls? Wait, no—wait, when bats increase from 54 to 61, labor for bats increases from 60 to 80 workers. Thus, labor for balls decreases from 40 to 20 workers. Wait, no: original labor for bats at 54 is 60 workers (so balls: 100 - 60 = 40 workers, producing 167? Wait, no, the balls table: 40 workers produce 167 balls. Wait, let’s re-express:
- When bats = 54: 60 workers produce bats (so 100 - 60 = 40 workers produce balls → balls = 167).
- When bats = 61: 80 workers produce bats (so 100 - 80 = 20 workers produce balls → balls = 100).
Thus, the decrease in balls is \( 167 - 100 = 67 \). Wait, but the problem’s box shows 67, but let’s verify:
Wait, no—wait, when bats go from 54 to 61, the change in bats is \( 61 - 54 = 7 \) bats. The change in balls: when bats are 54, balls are 167 (40 workers). When bats are 61, balls are 100 (20 workers). So opportunity cost is \( 167 - 100 = 67 \) balls.
Part c: Feasibility of 167 Balls and 84 Bats
To check feasibility, we need to see if 167 balls and 84 bats can be produced with 100 workers.
- Balls = 167: From the balls table, 40 workers produce 167 balls.
- Bats = 84: From the bats table, how many workers? The bats table has: 80 workers → 61 bats; 100 workers → 65 bats. 84 bats is more than 65 (max bats with 100 workers). Thus, 84 bats is unattainable (outside the production possibilities frontier).
Final Answers (for Part b):
The opportunity cost of increasing bats from 54 to 61 is \(\boldsymbol{67}\) balls (since 167 - 100 = 67).
(Note: For part c, the output of 167 balls and 84 bats is infeasible because 84 bats exceeds the maximum possible bats (65) with 100 workers.)

Snap & solve any problem in the app
Get step-by-step solutions on Sovi AI
Photo-based solutions with guided steps
Explore more problems and detailed explanations
Part a: Completing the Production Possibilities Table
To complete the table, we analyze the labor allocation. The total labor force is 100 workers. For each row (A to F), the number of workers producing balls and bats must sum to 100. We use the given production tables to find the corresponding production of the other good.
- Row A: Balls = 0 (0 workers). So, 100 workers produce bats. From the bats table, 100 workers produce 65 bats.
- Row B: Balls = 100 (20 workers). So, 100 - 20 = 80 workers produce bats. From the bats table, 80 workers produce 61 bats.
- Row C: Balls = 167 (40 workers). So, 100 - 40 = 60 workers produce bats. From the bats table, 60 workers produce 54 bats.
- Row D: Balls = 217 (60 workers). So, 100 - 60 = 40 workers produce bats. From the bats table, 40 workers produce 42 bats.
- Row E: Balls = 250 (80 workers). So, 100 - 80 = 20 workers produce bats. From the bats table, 20 workers produce 23 bats.
- Row F: Balls = 267 (100 workers). So, 0 workers produce bats. From the bats table, 0 workers produce 0 bats.
Part b: Opportunity Cost of Bats (54 to 61 units)
Opportunity cost is the decrease in balls production when bats production increases.
- Bats = 54: From the balls table, 60 workers produce 217 balls (since 100 - 60 = 40 workers produce bats for 54 bats).
- Bats = 61: From the balls table, 80 workers produce 250 balls? Wait, no—wait, when bats increase from 54 to 61, labor for bats increases from 60 to 80 workers. Thus, labor for balls decreases from 40 to 20 workers. Wait, no: original labor for bats at 54 is 60 workers (so balls: 100 - 60 = 40 workers, producing 167? Wait, no, the balls table: 40 workers produce 167 balls. Wait, let’s re-express:
- When bats = 54: 60 workers produce bats (so 100 - 60 = 40 workers produce balls → balls = 167).
- When bats = 61: 80 workers produce bats (so 100 - 80 = 20 workers produce balls → balls = 100).
Thus, the decrease in balls is \( 167 - 100 = 67 \). Wait, but the problem’s box shows 67, but let’s verify:
Wait, no—wait, when bats go from 54 to 61, the change in bats is \( 61 - 54 = 7 \) bats. The change in balls: when bats are 54, balls are 167 (40 workers). When bats are 61, balls are 100 (20 workers). So opportunity cost is \( 167 - 100 = 67 \) balls.
Part c: Feasibility of 167 Balls and 84 Bats
To check feasibility, we need to see if 167 balls and 84 bats can be produced with 100 workers.
- Balls = 167: From the balls table, 40 workers produce 167 balls.
- Bats = 84: From the bats table, how many workers? The bats table has: 80 workers → 61 bats; 100 workers → 65 bats. 84 bats is more than 65 (max bats with 100 workers). Thus, 84 bats is unattainable (outside the production possibilities frontier).
Final Answers (for Part b):
The opportunity cost of increasing bats from 54 to 61 is \(\boldsymbol{67}\) balls (since 167 - 100 = 67).
(Note: For part c, the output of 167 balls and 84 bats is infeasible because 84 bats exceeds the maximum possible bats (65) with 100 workers.)