QUESTION IMAGE
Question
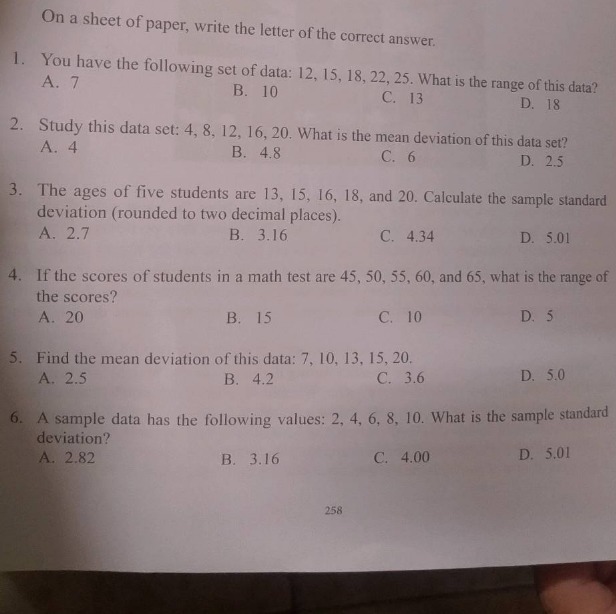
on a sheet of paper, write the letter of the correct answer.
- you have the following set of data: 12, 15, 18, 22, 25. what is the range of this data?
a. 7
b. 10
c. 13
d. 18
- study this data set: 4, 8, 12, 16, 20. what is the mean deviation of this data set?
a. 4
b. 4.8
c. 6
d. 2.5
- the ages of five students are 13, 15, 16, 18, and 20. calculate the sample standard deviation (rounded to two decimal places).
a. 2.7
b. 3.16
c. 4.34
d. 5.01
- if the scores of students in a math test are 45, 50, 55, 60, and 65, what is the range of the scores?
a. 20
b. 15
c. 10
d. 5
- find the mean deviation of this data: 7, 10, 13, 15, 20.
a. 2.5
b. 4.2
c. 3.6
d. 5.0
- a sample data has the following values: 2, 4, 6, 8, 10. what is the sample standard deviation?
a. 2.82
b. 3.16
c. 4.00
d. 5.01
Question 1
Step1: Recall range formula
Range is calculated as the difference between the maximum and minimum values in a data set. The formula is \( \text{Range} = \text{Max} - \text{Min} \).
Step2: Identify max and min
For the data set \( 12, 15, 18, 22, 25 \), the maximum value (\( \text{Max} \)) is \( 25 \) and the minimum value (\( \text{Min} \)) is \( 12 \).
Step3: Calculate range
Substitute into the formula: \( \text{Range} = 25 - 12 = 13 \).
Step1: Find the mean
First, calculate the mean (\( \bar{x} \)) of the data set \( 4, 8, 12, 16, 20 \). The formula for the mean is \( \bar{x} = \frac{\sum_{i = 1}^{n} x_i}{n} \), where \( n \) is the number of data points.
\( \sum_{i = 1}^{5} x_i = 4 + 8 + 12 + 16 + 20 = 60 \), and \( n = 5 \). So, \( \bar{x} = \frac{60}{5} = 12 \).
Step2: Calculate absolute deviations
Find the absolute deviation of each data point from the mean:
\( |4 - 12| = 8 \), \( |8 - 12| = 4 \), \( |12 - 12| = 0 \), \( |16 - 12| = 4 \), \( |20 - 12| = 8 \).
Step3: Find the mean of absolute deviations
The mean deviation is the mean of these absolute deviations. Using the formula \( \text{Mean Deviation} = \frac{\sum_{i = 1}^{n} |x_i - \bar{x}|}{n} \).
\( \sum_{i = 1}^{5} |x_i - \bar{x}| = 8 + 4 + 0 + 4 + 8 = 24 \), and \( n = 5 \). So, \( \text{Mean Deviation} = \frac{24}{5} = 4.8 \).
Step1: Find the mean
For the data set \( 13, 15, 16, 18, 20 \), calculate the mean (\( \bar{x} \)).
\( \sum_{i = 1}^{5} x_i = 13 + 15 + 16 + 18 + 20 = 82 \), \( n = 5 \). So, \( \bar{x} = \frac{82}{5} = 16.4 \).
Step2: Calculate squared deviations
Find \( (x_i - \bar{x})^2 \) for each data point:
- \( (13 - 16.4)^2 = (-3.4)^2 = 11.56 \)
- \( (15 - 16.4)^2 = (-1.4)^2 = 1.96 \)
- \( (16 - 16.4)^2 = (-0.4)^2 = 0.16 \)
- \( (18 - 16.4)^2 = (1.6)^2 = 2.56 \)
- \( (20 - 16.4)^2 = (3.6)^2 = 12.96 \)
Step3: Find the sum of squared deviations
\( \sum_{i = 1}^{5} (x_i - \bar{x})^2 = 11.56 + 1.96 + 0.16 + 2.56 + 12.96 = 29.2 \)
Step4: Calculate sample variance
Sample variance (\( s^2 \)) is \( \frac{\sum_{i = 1}^{n} (x_i - \bar{x})^2}{n - 1} \). Here, \( n - 1 = 4 \), so \( s^2 = \frac{29.2}{4} = 7.3 \)
Step5: Calculate sample standard deviation
Sample standard deviation (\( s \)) is the square root of the sample variance: \( s = \sqrt{7.3} \approx 2.7 \) (rounded to two decimal places). Wait, no, wait: Wait, \( \sqrt{7.3} \approx 2.7 \)? Wait, no, \( 2.7^2 = 7.29 \), which is close. But wait, let's recalculate the sum of squared deviations. Wait, 13+15+16+18+20: 13+15=28, 28+16=44, 44+18=62, 62+20=82. Mean is 82/5=16.4. Then (13-16.4)= -3.4, squared is 11.56; (15-16.4)= -1.4, squared 1.96; (16-16.4)= -0.4, squared 0.16; (18-16.4)=1.6, squared 2.56; (20-16.4)=3.6, squared 12.96. Sum: 11.56+1.96=13.52; 13.52+0.16=13.68; 13.68+2.56=16.24; 16.24+12.96=29.2. Then variance is 29.2/(5 - 1)=29.2/4=7.3. Standard deviation is sqrt(7.3)≈2.7. But the options have A. 2.7, B. 3.16, etc. Wait, maybe I made a mistake. Wait, let's check the data again. The ages are 13,15,16,18,20. Wait, 13,15,16,18,20. Let's recalculate the mean: 13+15=28, +16=44, +18=62, +20=82. 82/5=16.4. Then deviations: 13-16.4=-3.4, 15-16.4=-1.4, 16-16.4=-0.4, 18-16.4=1.6, 20-16.4=3.6. Squared deviations: 11.56, 1.96, 0.16, 2.56, 12.96. Sum: 11.56+1.96=13.52; +0.16=13.68; +2.56=16.24; +12.96=29.2. Variance (sample) is 29.2/4=7.3. Standard deviation is sqrt(7.3)≈2.7. So the answer is A? Wait, but let's check the options. Option A is 2.7. So maybe that's correct. Wait, but let's recheck. Alternatively, maybe I miscalculated the sum. Wait, 13+15+16+18+20: 13+15=28, 28+16=44, 44+18=62, 62+20=82. Correct. Mean 16.4. Correct. Then squared deviations: correct. Sum 29.2. Variance 29.2/4=7.3. Std dev sqrt(7.3)≈2.7. So answer A.
Wait, but let's check with another approach. Maybe the data is different? Wait, the problem says "the ages of five students are 13, 15, 16, 18, and 20". So that's correct. So sample standard deviation is sqrt(7.3)≈2.7, so option A.

Snap & solve any problem in the app
Get step-by-step solutions on Sovi AI
Photo-based solutions with guided steps
Explore more problems and detailed explanations
C